Figures & data
Table 1 Summary of MRI Acquisition Parameters for in vivo Imaging
Table 2 Summary and Comparison of the Contrast Agent Formulations’ Different Physicochemical Properties
Figure 1 Comparison of physicochemical properties of the particles. (A) Intensity-weighted hydrodynamic size distribution. (B) -potential distribution at pH 7.4. 3 T MRI derived T1 (C), T2 (D) and T2* (E) relaxation rates as a function of iron concentration. The relaxivity r is derived from the slope of the corresponding linear fit.
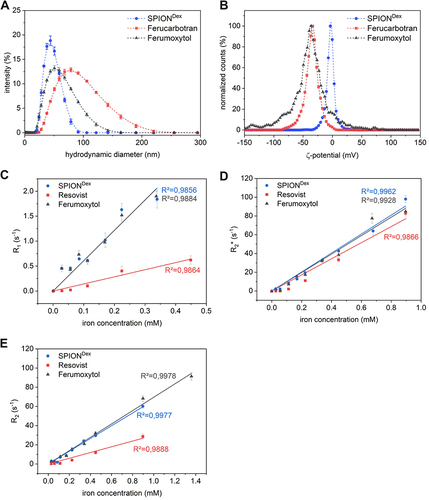
Figure 2 Cytotoxicity of nanoparticles. (A) Viability of Jurkat cells after treatment with nanoparticles for 24 h determined by AxV-PI staining. (B) Cellular nanoparticle uptake determined by FACS side scatter intensity. (C) Reactive oxygen species formation in cells measured by DCFH fluorescence. (D) Effect of contrast agents on intrinsic blood coagulation pathway. (E) Activation of thrombocytes. (F) Formation of neutrophil extracellular traps.
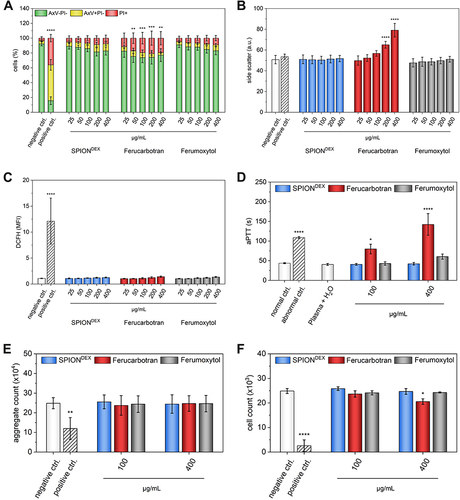
Figure 3 Contrast agent-induced complement activation. (A) Determination of the iC3b split product, in human-derived platelet-poor plasma (n=3). Relative hemodynamic changes as indication of in vivo complement activation in a porcine model after administration of SPIONDex (B), ferucarbotran (C), and ferumoxytol (D) at an iron concentration of 5 mg/kg. The latter resulted in anaphylaxis and requiring subsequent cardiopulmonary resuscitation. (E) Comparisons of maximum pulmonary artery pressure after contrast agent application (data for both doses, 0.5 and 5.0 mg Fe/kg, are pooled). (F) Normalized thromboxane B2 levels in pigs acquired from blood samples collected during application. (G) Example image of flushes appearing in the abdominal region after ferumoxytol application.
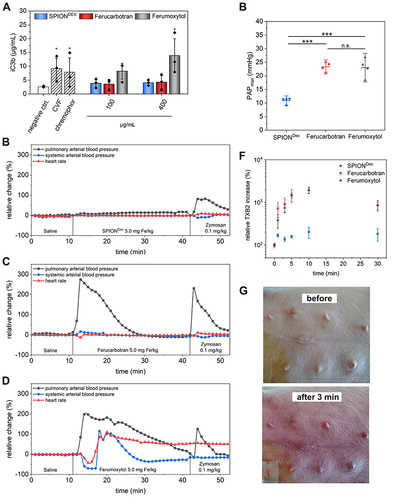
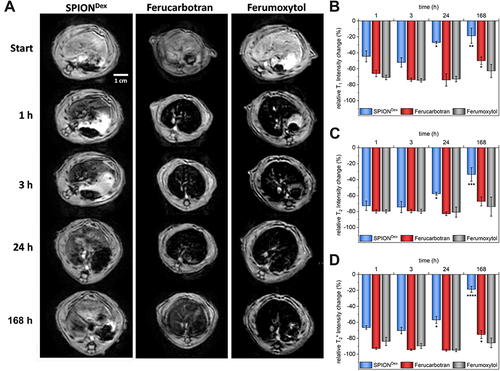
Figure 4 MRI experiments in rats. (A) Exemplary transversal T2*-weighted MRI of a rat’s liver before and at specific time points after administration of contrast agents at an iron dose of 2.6 mg Fe /kg. Qualitative evaluation of liver uptake and elimination of contrast agents from the liver based on T1-weighted (B), T2-weighted (C), and T2*-weighted (D) scans (n=3).