Figures & data
Figure 1 The dissolution profiles of TSIIA and SDs and PMs prepared using different ratios of TSIIA/silica nanoparticles (1:1, 1:3, 1:5, and 1:7 SDs and 1:5 PMs).
Note: Each point represents the mean ± standard deviation (n = 3).
Abbreviations: PMs, physical mixtures; SDs, solid dispersions; TSIIA, tanshinone IIA.
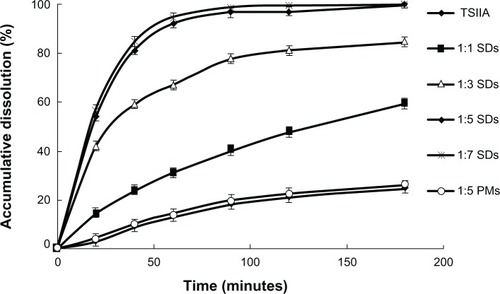
Figure 2 Scanning electron microscopy photomicrographs of (A) TSIIA and (B) SDs prepared using a TSIIA/silica nanoparticles ratio of 1:5.
Abbreviations: SDs, solid dispersions; TSIIA, tanshinone IIA.
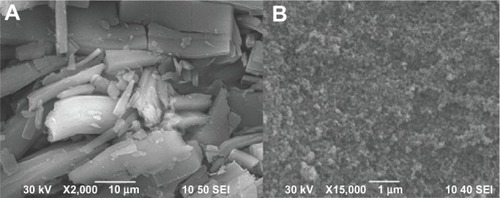
Figure 3 Differential scanning calorimetry curves of pure TSIIA (A), silica nanoparticles (B), and PMs (C) and SDs prepared at a TSIIA/silica nanoparticles ratio of 1:5 (D).
Abbreviations: Exo, exothermic direction; PMs, physical mixtures; SDs, solid dispersions; TSIIA, tanshi-none IIA.
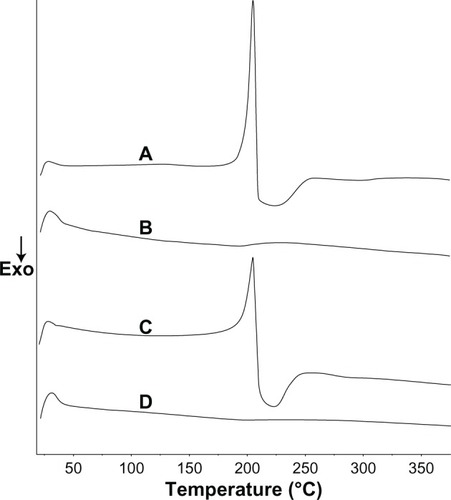
Figure 4 The X-ray powder diffractograms of TSIIA (A), silica nanoparticles (B) and PMs (C) and SDs with a TSIIA/silica nanoparticle ratio of 1:5 (w/w) (D).
Abbreviations: PMs, physical mixtures; SDs, solid dispersions; TSIIA, tanshinone IIA; w/w, weight by weight.
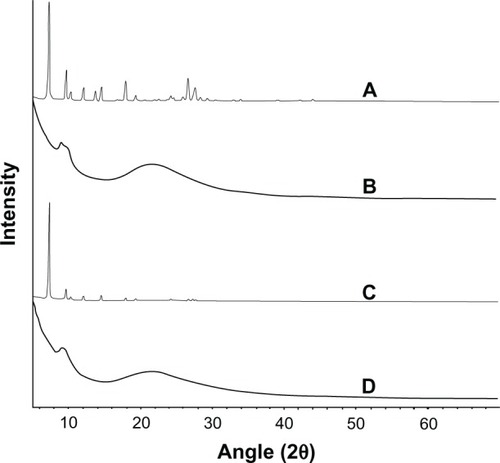
Figure 5 The IR spectra of TSIIA (A), silica nanoparticles (B) and PMs (C) and SDs with a TSIIA/silica nanoparticle ratio of 1:5 (w/w) (D).
Abbreviations: IR, infrared; PMs, physical mixtures; SDs, solid dispersions; TSIIA, tanshinone IIA; w/w, weight by weight.
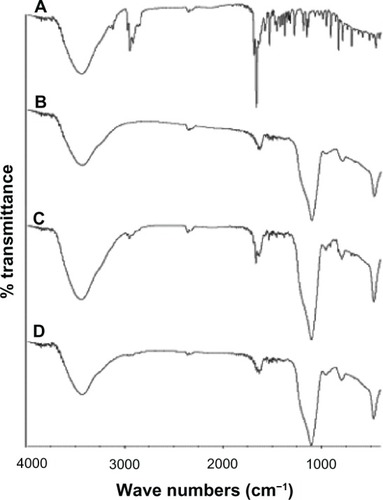
Table 1 Stability test of SDs
Figure 6 The mean plasma concentration-time curve of TSIIA in rats after oral administration of SDs, PMs, and TSIIA equivalent to 60 mg kg−1 of TSIIA (n = 6).
Notes: The values are represented as the mean ± standard deviation (n = 6/group/time point).
Abbreviations: PMs, physical mixtures; SDs, solid dispersions; TSIIA tanshi-none IIA.
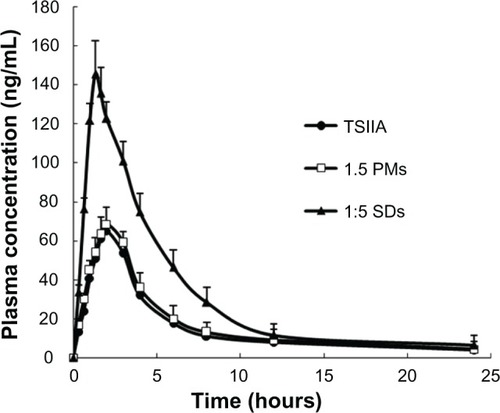
Table 2 The main pharmacokinetic parameters of TSIIA after oral administration of TSIIA, PMs or SDs in rats (n = 6) at a dose of 60 mg/kg