Figures & data
Figure 1 The binding curves between peptide ligands and p32 protein and the 1:1 Langmuir model fitting (response units increase as the concentration of p32 protein increases from 50 nM to 400 nM). (A) Interaction between Syp-1 and p32; (B) Interaction between Lyp-1 and p32.
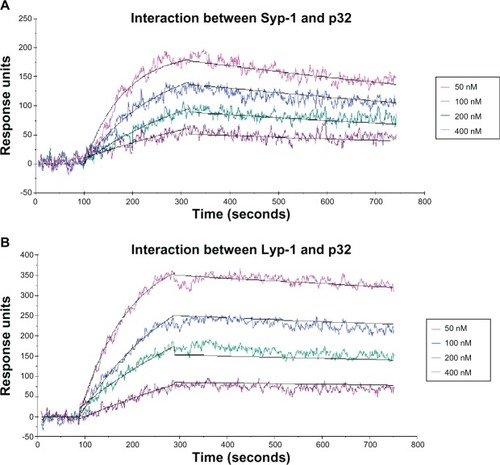
Figure 2 1H-NMR spectra of (A) MAL-PEg3400-DSPE, (B) Lyp-1-PEg3400-DSPE, and (C) Syp-1-PEg3400-DSPE at 400 MHz.
Abbreviations: MAL-PEg3400-DSPE, maleimide-derivatized PEg-DSPE; PEg-DSPE, phosphatidylethanolamine distearoyl methoxypolyethylene glycol conjugate.
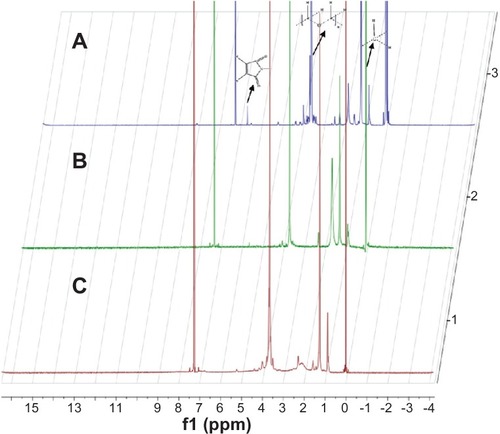
Figure 3 Proteolytic stability of Lyp-1 and Syp-1 against serum.
Notes: Peptide stability was calculated by dividing the residual amount by the original amount at predetermined time intervals (expressed as percent residual peptide). This assay was detected by HPLC and performed in triplicate.
Abbreviation: HPLC, high performance liquid chromatography.
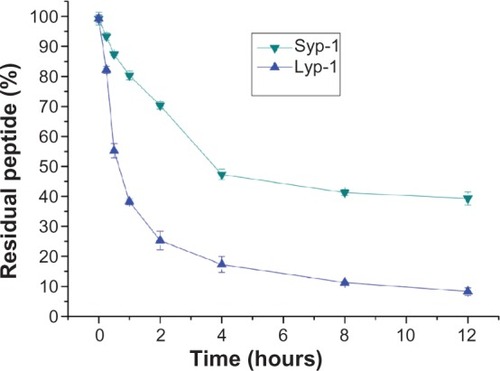
Figure 4 (A and C): Quantitative and qualitative analysis of the internalization of different FAM-containing liposomes by MDA-MB-435 cells in culture medium for 2 hours at the concentration of 1 μM (FAM). (B and D): Analysis after pre-incubation with serum for 1 hour at 37°C.
Notes: These quantitative assays were performed in triplicate. Data represented as mean ± SD (n = 3). *P < 0.05; **P < 0.01.
Abbreviations: FAM, 5-carboxyfluorescein; SD, standard deviation; P-LS/FAM, PEG-liposomes loading FAM; S-P-LS/FAM, Syp-1-PEG-liposomes loading FAM; L-P-LS/FAM, Lyp-1-PEg-liposomes loading FAM; PEg, polyethylene glycol.
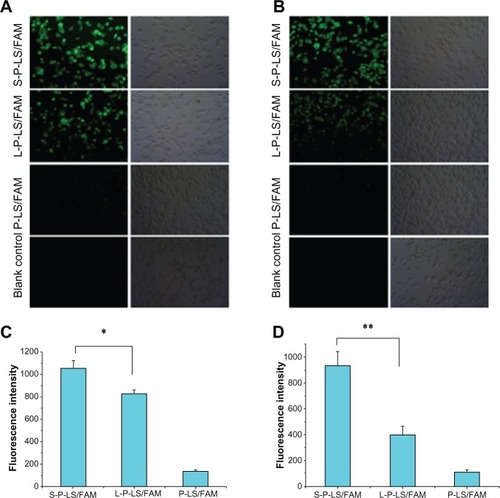
Figure 5 In vivo near-infrared fluorescence imaging of xenografts in nude mice after intravenous injection of DiR-loaded liposomes.
Abbreviations: DiR, 1,1′-dioctadecyl-3,3,3,3′ tetramethyl indotricarbocyanine iodide; P-LS/DiR, PEG-liposomes loading DiR; S-P-LS/DiR, Syp-1-PEG-liposomes loading DiR; L-P-LS/DiR, Lyp-1-PEG-liposomes loading DiR; PEG, polyethylene glycol.
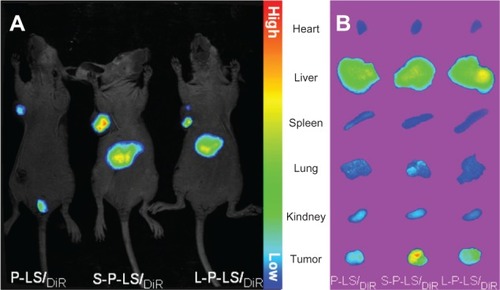
Figure 6 In vitro antitumor activity of liposomal doxorubicin against MDA-MB-435 cells was evaluated by MTT colorimetric assay and performed in triplicate.
Notes: Relative cell viability was determined on the basis of optical density values of sample wells versus reference wells. Data represented as mean ± SD (n = 3).
Abbreviations: MTT, methylthiazolyldiphenyl-tetrazolium bromide; SD, standard deviation; DOX, doxorubicin; S-P-LS/DOX, Syp-1-PEG-liposomes loading DOX; P-LS/DOX, PEG-liposomes loading DOX; L-P-LS/DOX, Lyp-1-PEG-liposomes loading DOX; PEg, polyethylene glycol.
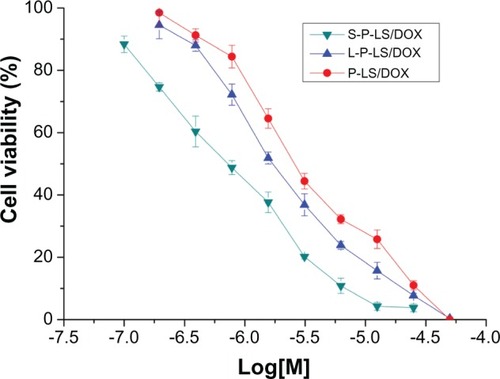
Figure 7 Antitumor efficacy of liposomal DOX in vivo.
Notes:P < 0.01 for S-P-LS/DOX versus P-LS/DOX and P < 0.05 for S-P-LS/DOX versus L-P-LS/DOX. Data represented as mean ± SD (n = 6). *P < 0.05; **P < 0.01.
Abbreviations: DOX, doxorubicin; S-P-LS/DOX, Syp-1-PEG-liposomes loading DOX; P-LS/DOX, PEG-liposomes loading DOX; L-P-LS/DOX, Lyp-1-PEG-liposomes loading DOX; SD, standard deviation; PEg, polyethylene glycol.
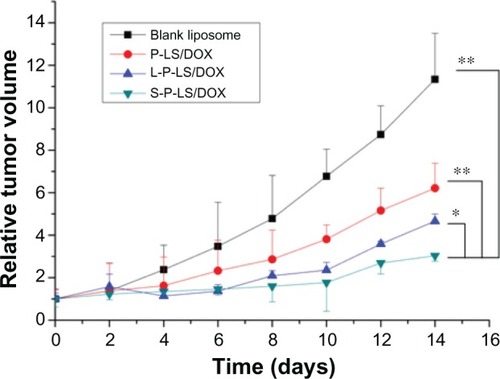
Figure S1 Syp-1 peptide analyzed by (A) HPLC and (B) ESI-MS.Notes: HPLC analysis was performed at 40°C on a C4 column using a linear gradient of 5%–65% acetonitrile containing 0.1% TFA at a flow rate of 1 mL/minute for 30 minutes.Abbreviations: HPLC, high-performance liquid chromatography; ESI-MS, electrospray ionization mass spectrometry; TFA, trifluoroacetic acid.
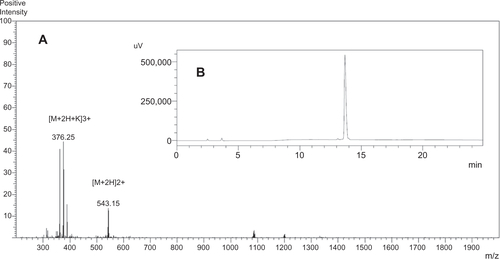
Table S1 Kinetic parameters and affinities of interaction between peptide and p32
Table S2 The properties of FAM, DiR, or DOX-loaded liposomes with or without peptide modification