Figures & data
Figure 1 The proposed data collection and processing framework.
Abbreviation: QSARs, quantitative structure-activity relationships.
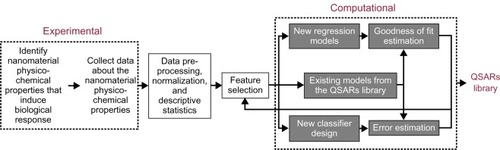
Figure 2 Photograph of the nanoparticle samples used in the study.
Notes: The nanoparticles were suspended in either ultrapure water or Dulbecco’s Modified Eagle’s Medium. The concentration of the particles in the aqueous suspension was 100 mg/L. The photograph was taken immediately after sonication.
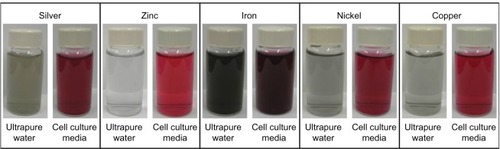
Figure 3 The surface chemistry properties of the engineered nanoparticles. (A) The autofluorescence of each engineered nanoparticle in ultrapure water over 24 hours. Particle suspensions were sonicated for 1 minute before each fluorescence measurement. (B) The reactive oxygen species production, as measured by 2′,7′-dichlorfluorescein-diacetate fluorescence, of each engineered nanoparticle over 7 days.
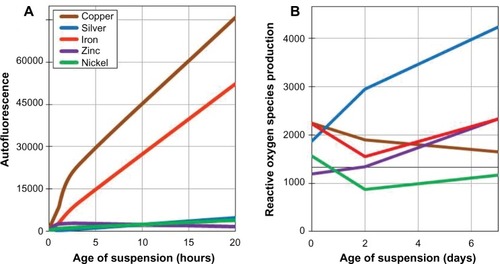
Figure 4 Boxplots for the silver data. (A) Raw data and (B) standardized data.
Abbreviations: Conc, concentration; ROS, reactive oxygen species.
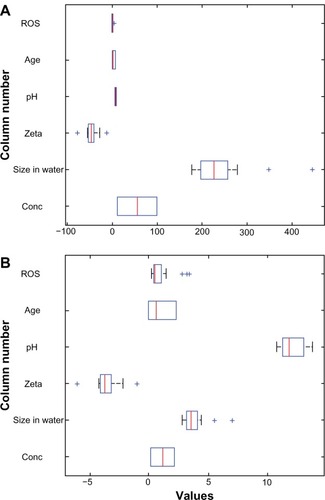
Figure 5 Principal component analyses Pareto plots. (A) All metal colloids combined in a single data set. (B) Silver data only. (C) Copper data only. (D) Iron data only. (E) Nickel data only. (F) Zinc data only.
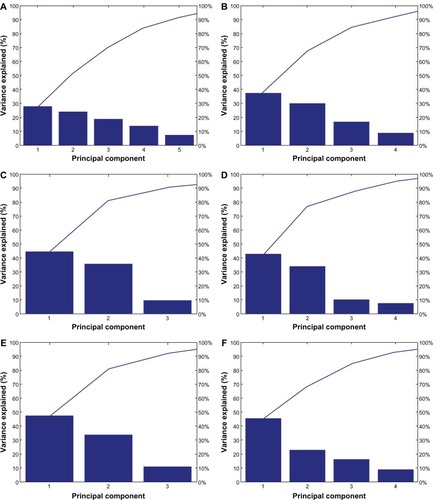
Table 1 Heat maps representing the relative weight of the original features in the respective principle components
Figure 6 Pair-wise correlations between the measured nanomaterial features.
Abbreviation: ROS, reactive oxygen species.
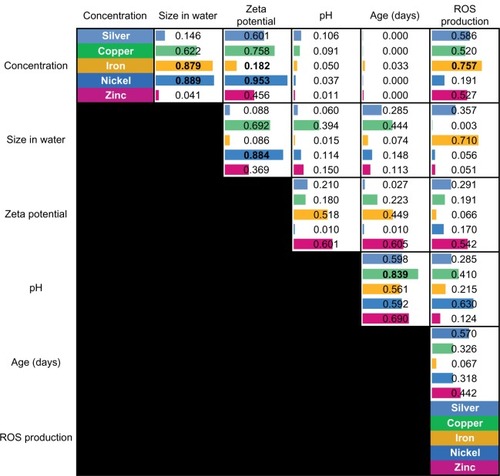
Figure 7 Linear discriminant analysis for iron versus the group of silver, copper, and nickel. (A) The features of concentration, zeta potential, and agglomerated size in water provide the best separation for the two groups when the entire data set is considered. (B) Zeta potential, agglomerated size in water, and age provide the best separation when only data for high concentrations (100 mg/L) are considered. (C) Zeta potential, agglomerated size in water, and age provide the best separation when only data for low concentrations (10 mg/L) are considered.
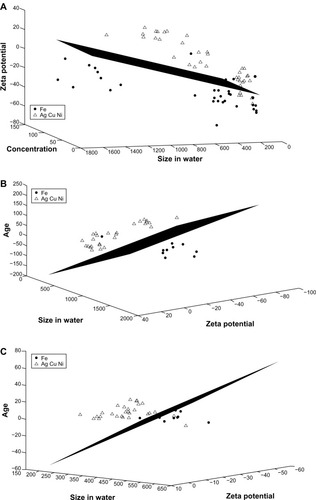
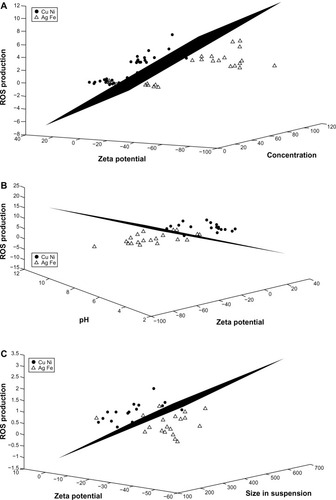
Figure 8 LDA for the copper-and-nickel group versus the silver-and-iron group. Zinc is excluded from the analyses. (A) The features of concentration, zeta potential, and ROS production provide the best separation for the two groups when the entire data set is considered. (B) Zeta potential, pH, and ROS production provide the best separation when only data for high concentrations (100 mg/L) are considered. (C) Zeta potential, agglomerated size in water, and ROS production provide the best separation when only data for low concentrations (10 mg/L) is considered.
Abbreviations: LDA, linear discriminant analysis; ROS, reactive oxygen species.