Figures & data
Table 1 Formulation and properties of ibuprofen-loaded cubic nanoparticles (n = 3)
Figure 1 (A) Mean particle size of ibuprofen-loaded cubic nanoparticles determined by a particle size analyzer (n = 3). (B) Size distribution and surface morphology of ibuprofen-loaded cubic nanoparticles examined by atomic force microscopy.
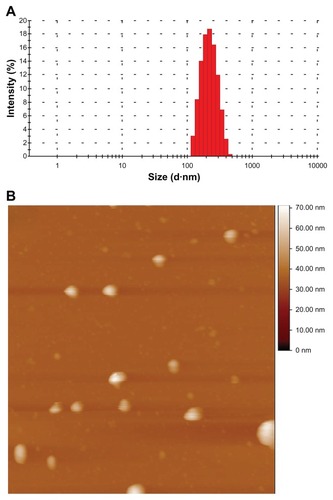
Figure 2 Cryogenic transmission electron microscopy image of ibuprofen-loaded cubic nanoparticles.
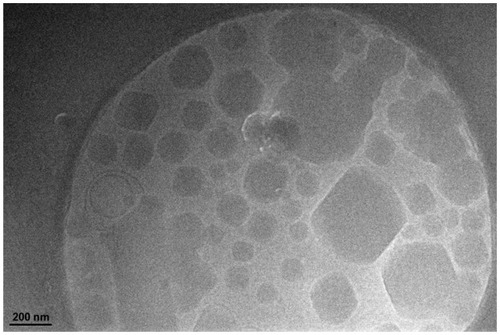
Figure 3 (A) Differential scanning calorimetry thermograms and (B) X-ray diffraction patterns of (a) pure ibuprofen, (b) a physical mixture of cubic nanoparticles and ibuprofen, (c) ibuprofen-loaded cubic nanoparticles, and (d) void cubic nanoparticles.
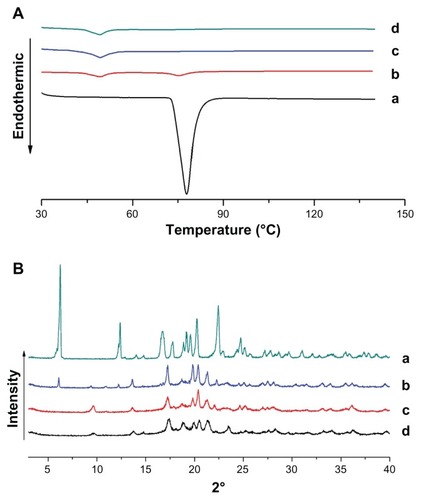
Figure 4 (A) Drug release from ibuprofen-loaded cubic nanoparticles and pure ibuprofen at pH 1.2 (n = 3). (B) Drug release from ibuprofen-loaded cubic nanoparticles and pure ibuprofen at pH 7.4 (n = 3).
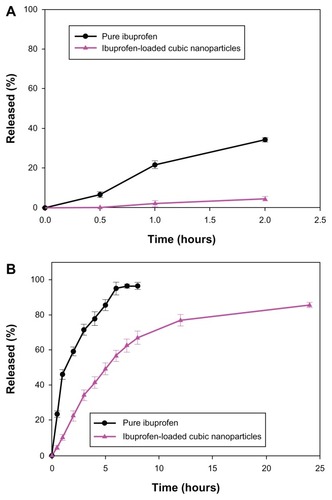
Table 2 Fitting of ibuprofen release data from cubic nanoparticles into various mechanism models (n = 3)
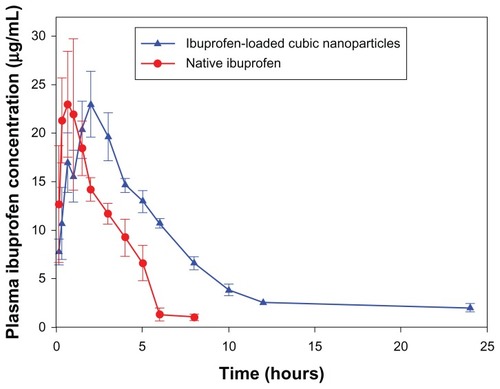
Table 3 Pharmacokinetic parameters (mean ± SD) of ibuprofen in serum after oral administration (n = 3)
Figure 5 Mean plasma ibuprofen concentration after a single oral dose of 15 mg/kg equivalent ibuprofen or ibuprofen-loaded cubic nanoparticles (n = 3).