Figures & data
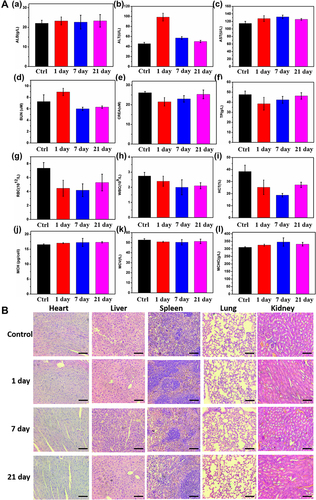
Figure 8 In vivo toxicity test of Mn-MoS2 QDs: (A(a–l)) Mouse serum biochemistry analysis and blood routine analysis before (0d, control) and after injection of Mn-MoS2 QDs for 1, 7, 21d. (B) Histological images of the heart, lungs, liver, spleen and kidneys of mice 1, 7 and 21 days post-intravenous injection of Mn-MoS2 QDs and in control mice. The organs were sectioned and stained with hematoxylin and eosin (H&E) and observed under a light microscope, scale bar = 100 μm.