Figures & data
Figure 1 Generation and characterization of two αTSR proteins. (A) Schematic constructs of the αTSR-Hisx6 (top panel), the GST-αTSR (middle panel), and the GST (bottom panel) proteins. (B–D) SDS-PAGE showing the purified αTSR-Hisx6 protein at ~10 kDa (B), the GST-αTSR protein at ~35 kDa (C), and the GST at ~26 kDa (D), respectively. Lanes E1 and/or E2 are elution fractions from the purification resin. M is protein markers with indicated molecular weights. 16% gel was used in (B), whereas 10% gels were used for (C and D). (E–G) Molecular weight (MW) determinations of the αTSR-Hisx6 (E), GST-αTSR (F), and GST proteins by electrospray ionization (ESI) and corresponding deconvoluted (insets) mass spectra, revealing 9801 Da, and 69,909 Da, and 54,281 Da, respectively.
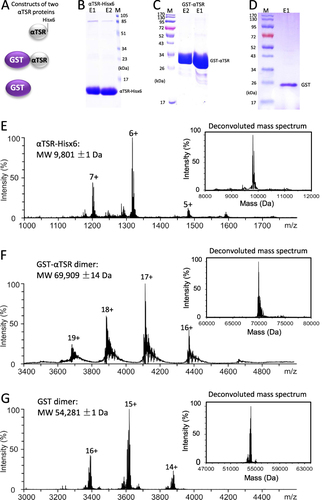
Figure 2 Binding of the αTSR proteins to heparan sulfate (HS) glycans. (A) Binding of the αTSR containing proteins to heparin sodium salt by EIA based binding assays. Y-axis shows binding signals in optical density (OD450), while X-axis denotes the proteins at indicated concentrations: red columns, 200 ng/µL; blue columns, 100 ng/µL; brown columns, 50 ng/µL; and while columns, 250 ng/µL. The cutoff signal value (OD450=0.1) is shown by a dashed line. (B) Screening of a HS glycan library consisting of 15 HS glycans using the αTSR-Hisx6, the GST-αTSR, and GST (indicated by blue fonts) as probes, respectively, through electrospray ionization mass spectrometry (ESI-MS). The order (#), name, composition, maximum number of sodium (Max # Na+), formula without sodium (Na+), and monoisotopic mass (Da) of each HS glycan, as well as their binding affinities in dissociation constants (KD, µM) to each of the GST-αTSR, the αTSR-Hisx6, or GST protein are shown. In the composition column, the numbers of sulfates are shown in red fonts. The KD is an average value (µM) ± standard deviation. NB ≡ no binding.
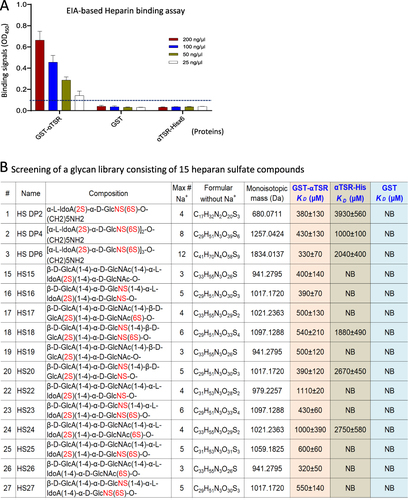
Figure 3 Production of the S60-αTSR nanoparticles. (A) Schematic construct of the S-αTSR fusion protein with a C-terminal Hisx6 tag. S, modified norovirus S domain; hinge, the hinge region of norovirus VP1. (B) SDS-PAGE analysis of the resin purified S-αTSR fusion protein showing a band at ~32 kDa. M, protein standards with indicated molecular sizes. (C) A gel-filtration elution curve of the S-αTSR protein through a size exclusion column, showing a major peak (P1, void volume) representing the S60-αTSR nanoparticle and two minor peaks (P2 and P3) representing the dimers and monomers of the S-αTSR protein. The elution peaks were calibrated using the S60-VP8* nanoparticle (~3.4 mDa) [20], norovirus P dimer (~69 kDa),Citation38 and GST dimers (54 kDa) with their elution positions being shown by star symbols and arrows on a red dashed line. Y-axis shows UV absorbances at A280 (mAU), while X-axis indicates elusion volume (mL). (D–F) Micrographs of transmission electron microscopy (TEM) of protein samples from the P1, P2, and P3, respectively, showing typical S60-αTSR nanoparticles (arrows). (G) Molecular weight determinations of the S60-αTSR nanoparticle by mass photometry. The complex of interest showed a molecular weight of 1967 ± 84 kDa, matching well with calculated molecular weight (1942.2 kDa) of the S60-αTSR nanoparticle. (H) Binding of the S60-αTSR proteins to heparin sodium salt by EIA based binding assays. Y-axis shows binding signals in optical density (OD450), while X-axis denotes the S60-αTSR proteins and its control proteins without the αTSR domain at indicated concentrations. The cutoff signal value (OD450=0.1) is shown by a dashed line.
![Figure 3 Production of the S60-αTSR nanoparticles. (A) Schematic construct of the S-αTSR fusion protein with a C-terminal Hisx6 tag. S, modified norovirus S domain; hinge, the hinge region of norovirus VP1. (B) SDS-PAGE analysis of the resin purified S-αTSR fusion protein showing a band at ~32 kDa. M, protein standards with indicated molecular sizes. (C) A gel-filtration elution curve of the S-αTSR protein through a size exclusion column, showing a major peak (P1, void volume) representing the S60-αTSR nanoparticle and two minor peaks (P2 and P3) representing the dimers and monomers of the S-αTSR protein. The elution peaks were calibrated using the S60-VP8* nanoparticle (~3.4 mDa) [20], norovirus P dimer (~69 kDa),Citation38 and GST dimers (54 kDa) with their elution positions being shown by star symbols and arrows on a red dashed line. Y-axis shows UV absorbances at A280 (mAU), while X-axis indicates elusion volume (mL). (D–F) Micrographs of transmission electron microscopy (TEM) of protein samples from the P1, P2, and P3, respectively, showing typical S60-αTSR nanoparticles (arrows). (G) Molecular weight determinations of the S60-αTSR nanoparticle by mass photometry. The complex of interest showed a molecular weight of 1967 ± 84 kDa, matching well with calculated molecular weight (1942.2 kDa) of the S60-αTSR nanoparticle. (H) Binding of the S60-αTSR proteins to heparin sodium salt by EIA based binding assays. Y-axis shows binding signals in optical density (OD450), while X-axis denotes the S60-αTSR proteins and its control proteins without the αTSR domain at indicated concentrations. The cutoff signal value (OD450=0.1) is shown by a dashed line.](/cms/asset/18cb2b08-00a4-4bc8-83dc-8092accf6ca1/dijn_a_12158218_f0003_c.jpg)
Figure 4 Analysis of the S60-αTSR nanoparticles after purification by cesium chloride (CsCl) density gradient centrifugation. (A) Following centrifugation, the CsCl density gradient containing the S60-αTSR nanoparticles was fractionated into 22 portions. The relative concentrations of the S60-αTSR protein in the fractions were measured by EIA assays using antibody against norovirus VLP. Y-axis indicates the fraction numbers, while X-axis shows signal intensities in optical density (OD450) with a red dashed line showing the cut-off signal at OD450=0.1. (B and C) A TEM micrograph of the S-αTSR protein of fraction 17 showing uniform S60-αTSR nanoparticles (B) with an enlargement of the framed area in (C) showing recognizable protrusions of αTSR antigens on the surface.
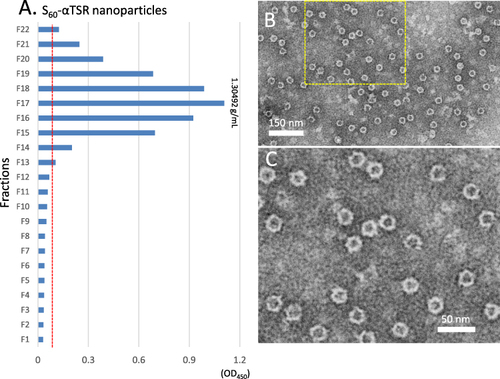
Figure 5 Production of tag-free S60-αTSR nanoparticles. (A) The schematic construct of the tag-free S-αTSR proteins. (B) SDS-PAGE showing the ammonium sulfate precipitated S-αTSR protein (Ppt) from the bacterial lysis. (C) An anion exchange elution curve of the ammonium sulfate precipitated proteins from (B). Y-axis shows UV absorbances at A280 (mAU), whereas X-axis indicates elusion volume (mL). The red dashed line indicates the linear increase of the elution buffer B (0–100%) with a red star symbol indicating the percentage of buffer B at the elution position of the S-αTSR protein (28.4%). Eight elution peaks (P1 to P8) that were analyzed by SDS-PAGE are indicated. (D) SDS-PAGE analyses of the eight elution peaks from the ion exchange (C). Five fractions from P6 were analyzed. M in (B and D) is protein standard with the molecular weights as indicated. The S-αTSR protein is eluted in P6. (E) A micrograph of transmission electron microscopy (TEM) of the protein sample from P6 showing typical S60-αTSR nanoparticles.
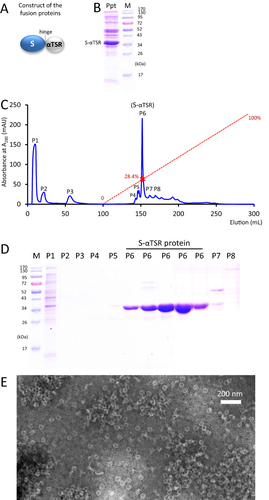
Figure 6 3D structures of the S60-αTSR nanoparticle. (A to (C) The S60-αTSR nanoparticle in surface view (A) showing its external structure; section view (B) showing its cross section, internal lumen, and interior structure, as well as surface view (C) of the S60 inner shell, respectively, revealing a T = 1 icosahedral symmetry. The colored bar shows the radii of the structures in different color schemes. (D–F) Fitting of a GII.4 norovirus S60 nanoparticle model (strain VA387, red cartoon representation) into the electron density map of the S60 shell region, showing in full (D) and slice (E) views, as well as slice view of the S60 shell (F), respectively. The blank protrusions representing the displayed αTSR antigens are indicated in (E). (G and H) Fitting of the crystal structures of 60 αTSR antigens (blue cartoon representation) into the electron density maps of the protrusion regions, showing in full (G) and slice (H) views respectively. (I) A zoom-in view of the fitting region of (H) showing the N- and C-terminal ends of two αTSR antigens. (J and K) Structural model of the S60-αTSR nanoparticle (J), with its surface displayed αTSR antigens (K). (L) Crystal structure of the inner shell of the 60-valent feline calicivirus (FCV) VLP (PDB code: 4PB6, Orange surface representation) showing the surface exposed C-terminal ends of the S domain. All images are shown at five-fold axes.
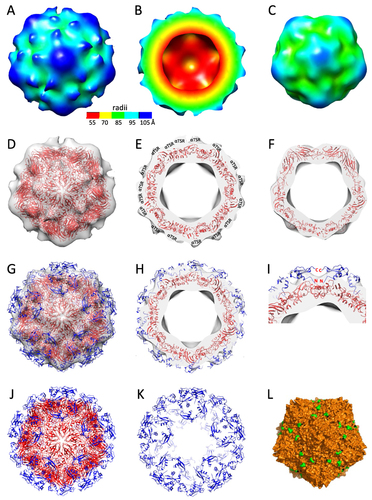
Figure 7 Immune response of the S60-αTSR nanoparticle in mice. (A) αTSR-specific IgG titers induced by the polyvalent S60-αTSR nanoparticle (S60-αTSR), the dimeric GST-αTSR protein (GST-αTSR), and the monomeric αTSR-Hisx6 protein (αTSR-Hisx6) after two (left four columns) and three (right four columns) immunizations are shown. Y-axes indicate αTSR-specific IgG titers, while X-axes indicate various immunogens. The S60 nanoparticle is a negative control. (B) Staining titers of the mouse sera after three immunizations of the S60-αTSR nanoparticle (S60-αTSR), and the αTSR-Hisx6 protein (αTSR-Hisx6) to air-dried P. falciparum sporozoites. Y-axis indicates staining titers, while X-axes indicate the two mouse sera. Statistic differences between data groups are shown as “**” for highly significant with P-values < 0.01 or “***” for extremely significant with P-values < 0.001.
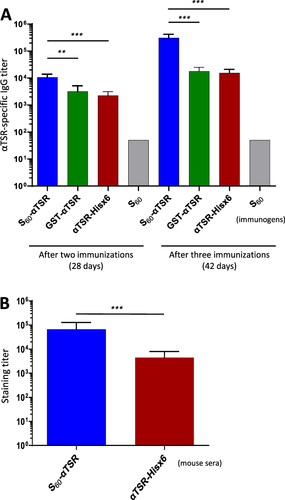
Figure 8 Representative micrographs of immunofluorescence assays (IFAs) of P. falciparum sporozoites by the mouse sera after immunization with the S60-αTSR nanoparticle and controls. (A–D) Typical IFA micrographs representing 16,000x (A and B) and 128,000x (C and D) dilutions, respectively, of the sera after immunization with the S60-αTSR nanoparticle. (E and F) Typical IFA micrographs representing 4000x dilution of the sera after immunization with the αTSR-Hisx6 protein. (G and H) Typical IFA micrographs representing 4000x dilution of the sera after immunization with the S60 nanoparticle without αTSR antigens. Each pair of micrographs consists of an IFA staining result (A, C, E and G) and the optical view of the same field (B, D, F and H). Arrows in the optical field of view indicate some sporozoites showed in the corresponding IFA views.
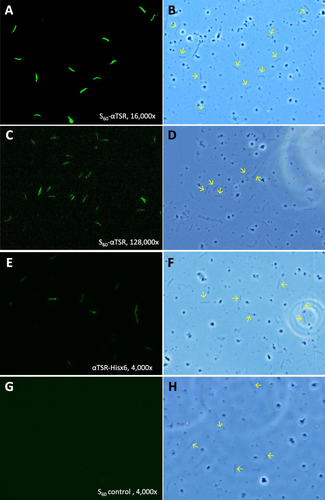
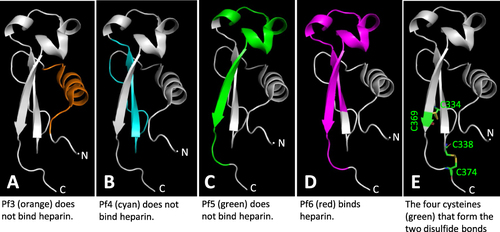
Figure 9 Structural analyses of four tested αTSR related peptides for binding to heparan sulfates and the two disulfide bonds reported in literature. The regions and structures of the four αTSR peptides, Pf3 (A, Orange), Pf4 (B, cyan), Pf5 (C, green), and Pf6 (D, purple),Citation24 corresponding to the known crystal structure of the αTSRCitation16 (in grey) are shown. The four cysteines forming the two disulfide bonds are shown in green in (E).