Figures & data
Table 1 IC50 and CI Values of HepG2 Treated with Drugs in Different Mass Ratios for 24 h
Table 2 The Size, PDI, EE, DLC of the Nano-Self assemblies Before and After Freeze Drying (n=3)
Figure 1 The particle size and morphology of four nanoself-assemblies. (A) PD@TAN-Nanos, (B) PD@GA-Nanos, (C) DCA@TG-Nanos, (D) PD@TG-Nanos.
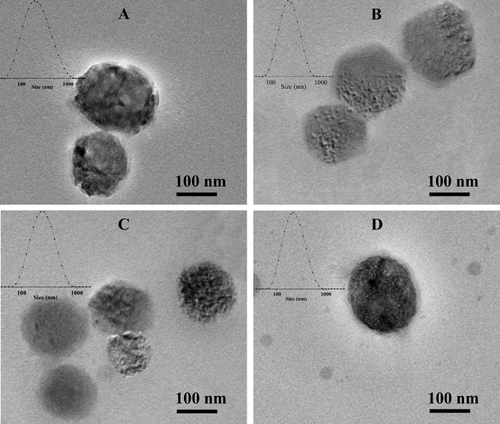
Table 3 Prediction of Binding Energy
Figure 2 The DSC thermogram of nanoself-assemblies.
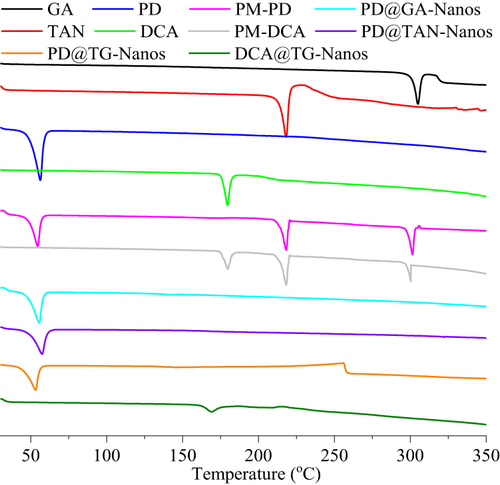
Figure 3 The results of physical stability test in vitro. (A) Dilution stability; (B) Storage stability at room temperature; (C) Storage stability at 4°C; (D) Plasma stability.
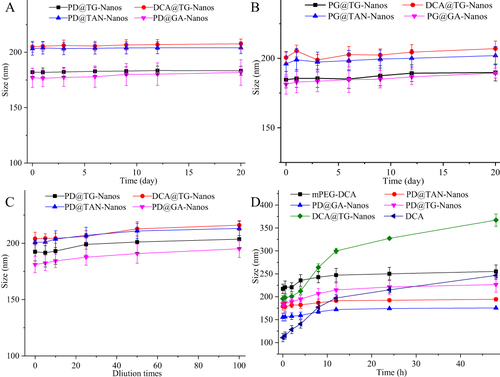
Figure 4 The results of chemical stability test in vitro. (A) The thermal stability of TAN in the different formulations, (B) The thermal stability of GA in the different formulations, (C) The photostability of TAN in the different formulations, (D) The photostability of GA in the different formulations, (E) The pH stability of TAN in the different formulations, (F) The pH stability of GA in the different formulations.
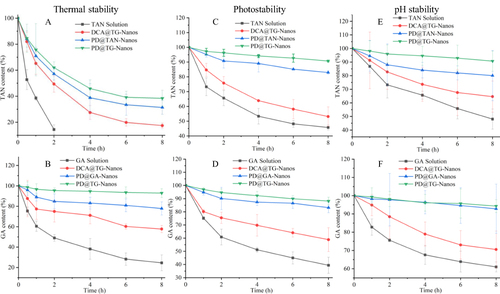
Figure 5 TAN release curves from the nanoself-assemblies (A); GA release curves from the nanoself-assemblies (B); In vitro cytotoxicity of the nanoself-assemblies on human normal liver cell line HL-7702 and human hepatoma cell line HepG2 for 24 h (C and E) and 48 h (D and F); The error bars was calculated from the data of three repetitions.
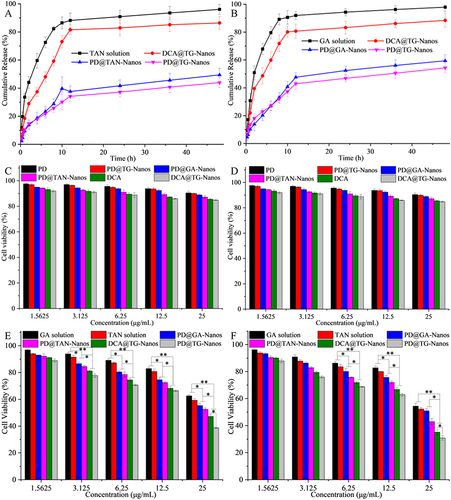
Figure 6 Tissue distributions of TAN (A) and GA (B) in the primary organs and tumor tissues after I.V. administration with the nanoself-assemblies at 15 mg/kg (n=10).
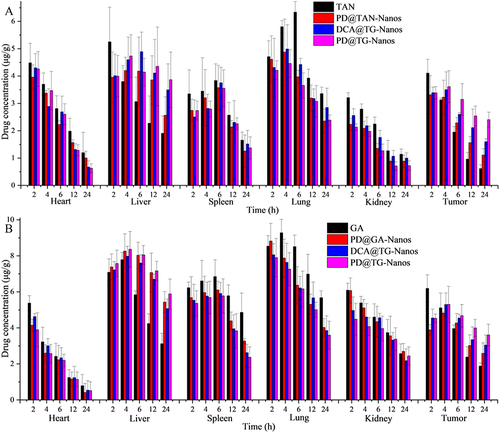
Table 4 Main Pharmacokinetic Parameters of TAN Injection and Its Preparations
Figure 7 (A) Mean plasma concentration vs time curves of various formulations after I.V. administration at 15 mg/kg. Data are expressed as the mean±s.d. (n=5). (B) Tumor growth inhibition curves (n=18), *P<0.05, **P<0.01, ***P<0.001. (C) Body weights of mice bearing H22 tumors after different treatments for 14 days (n=18), *P<0.05. (D) The curve of mice survival for 14 days.
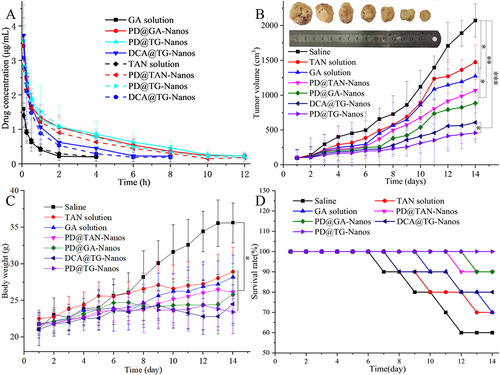
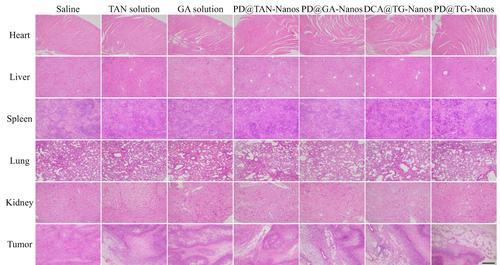
Figure 8 H&E analyses of the main organs and tumor tissues after treatment with various formulations. The scale bar represents 250 μm in the H&E images.