Figures & data
Figure 1 Identification of P. aeruginosa PA75. (A) MALDI-TOF-MS of PA75; (B) Agarose electrophoresis of 16S rDNA PCR products of P. aeruginosa PA75; (C) the phylogenetic tree of P. aeruginosa PA75.
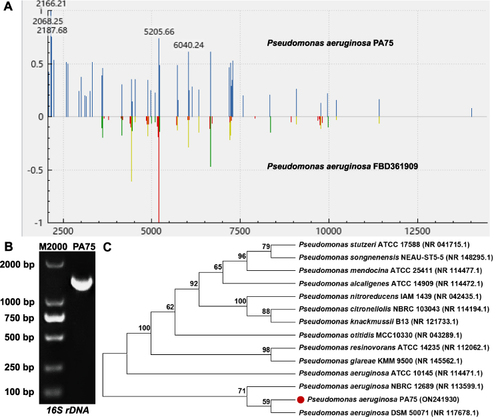
Figure 2 Extraction of P. aeruginosa PA75 biofilm supernatant. (A) Cell-free P. aeruginosa PA75 biofilm supernatant; Inhibitory effect of the biofilm supernatant on (B) bacterial growth and (C) biofilm formation of S. epidermidis ATCC35984. ***P < 0.001. Treat: the group treated with the biofilm supernatant, Non-Treat: the group treated with ultrapure water and NC: negative control.
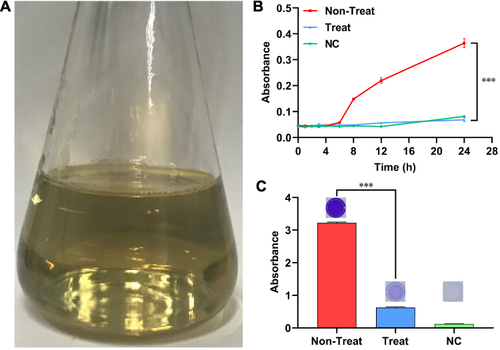
Figure 3 Green synthesis of BF75-AgNPs. (A) Visual observation of the BF75-AgNPs solution; (B) Visual observation of the BF75-AgNPs lyophilized powder; (C) UV-vis spectrum of the BF75-AgNPs before and after 30 days at 4°C.
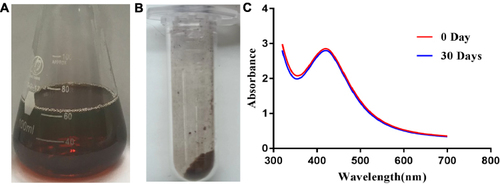
Figure 4 Characterization of BF75-AgNPs. (A) Particle size distribution; (B) Apparent Zeta potential and (C) TEM image of the BF75-AgNPs; (D) the average particle size of BF75-AgNPs based on the TEM image.
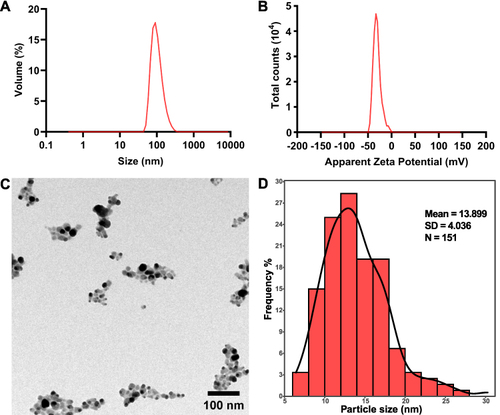
Figure 5 Characterization of BF75-AgNPs. (A) SEM image of the BF75-AgNPs and (B) distribution of sliver in elemental mapping; (C) EDX spectrum of BF75-AgNPs; (D) The 2D and 3D AFM images of the BF75-AgNPs; (E) XRD pattern diffractogram and (F) FTIR spectrum of the BF75-AgNPs.
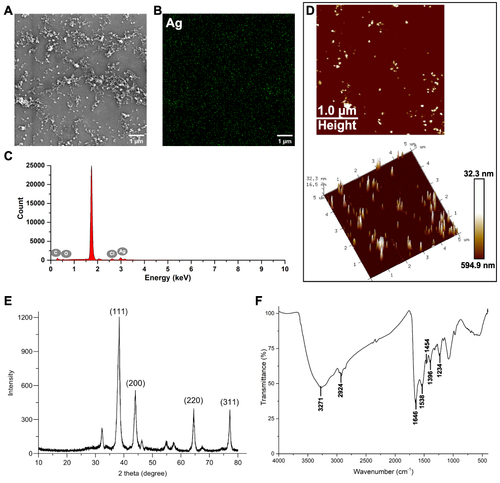
Table 1 Antibacterial Effects of BF75-AgNPs Against Four Different Multidrug-Resistant Strains
Figure 6 Bactericidal effects of BF75-AgNPs. Images of (A) live/dead cell staining and (B) FE-SEM of five XDR-KP strains treated with the BF75-AgNPs at 1/2 × MIC and ultrapure water for 8 h. The symbols a–e and f–j correspond to the control and AgNPs groups, respectively, for the strains XDR-KP1 through XDR-KP5.
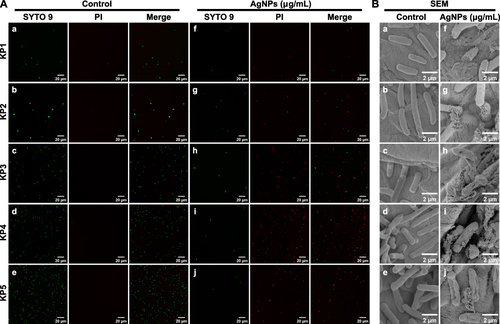
Figure 7 Changes of ROS expression levels in five XDR-KP strains treated with BF75-AgNPs. (A) Flow cytometry histograms and (B) fluorescence images of five XDR-KP strains treated with the BF75-AgNPs at 1/2 × MIC for 4 h; (C) The ROS expression levels of five XDR-KP strains in control group and AgNPs group were compared according to the mean fluorescence intensity of flow cytometry histograms. ****P < 0.0001.
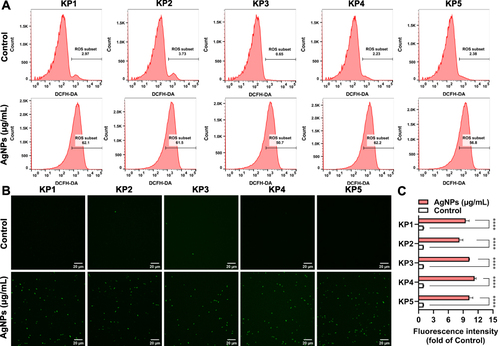
Table 2 MICs of BF75-AgNPs and Colistin (Alone or Combination) and FICIs of BF75-AgNPs in Combination with Colistin
Figure 8 Antibiofilm activity of BF75-AgNPs. (A) The biofilm inhibition rate of the BF75-AgNPs against three strong biofilm-forming strains (KP3, KP4 and KP5) at 7.5–120 μg/mL; (B) CFU counts and (C) Live/dead cell staining images of the biofilms treated with the BF75-AgNPs at 0, 60 and 120 μg/mL for 24 h. *P < 0.05, **P < 0.01 and ***P < 0.001.
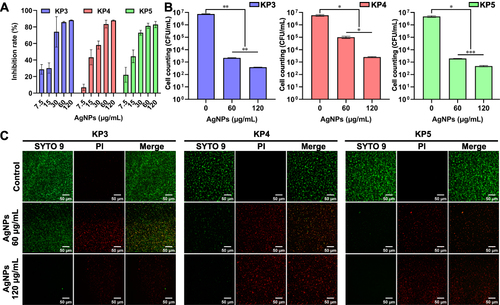
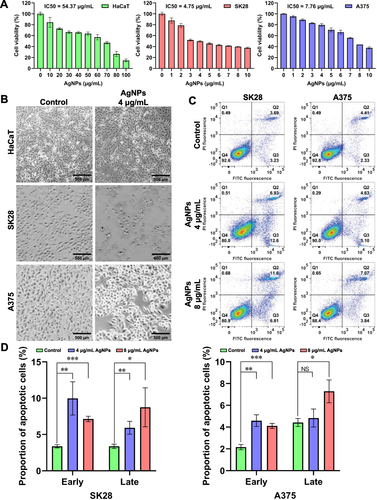
Figure 9 Antitumor activity of the BF75-AgNPs. (A) Cytotoxicity assessment of HaCaT, SK28 and A375 cells treated with the BF75-AgNPs at different concentrations for 24 h; (B) Cell morphology images of HaCaT, SK28 and A375 cells treated with the BF75-AgNPs at 0 and 4 μg/mL for 24 h; (C) Flow cytometry scatter plots of SK28 and A375 cells treated with the BF75-AgNPs at 0, 4 and 8 μg/mL for 24 h. Quadrants are as follows: Q1, necrotic cells; Q2, late apoptotic cells; Q3, early apoptotic cells; and Q4, viable cells. (D) the difference was compared by the triplicates. P > 0.05, *P < 0.05, **P < 0.01 and ***P < 0.001.