
Figures & data
Figure 1 Physicochemical characterization of diamond nanoparticles. (A) Transmission electron microscopy image of diamond nanoparticles. (B) Atomic force microscopy image and (C) a topography model of the diamond nanoparticles on a silicon wafer. (D) Raman spectrum of diamond nanoparticles. (E) FTIR spectrum of diamond nanoparticles. (F) Mean zeta potential of diamond nanoparticles after 24 hours incubation in water (“H2O”) and full Human Large Vessel Endothelial Cell Basal Medium (“Medium”). Mean hydrodynamic size (G) and polydispersity index (H) of diamond nanoparticles after 24 hours incubation in H2O and medium. Statistical significance is indicated with different superscripts (P < 0.05; n = 9 with at least 15 individual replicates). Representative hydrodynamic size distribution of diamond nanoparticles after 24 hours incubation in H2O (I) and medium (J). Representative zeta potential distribution of diamond nanoparticles after 24 hours incubation in H2O and medium.
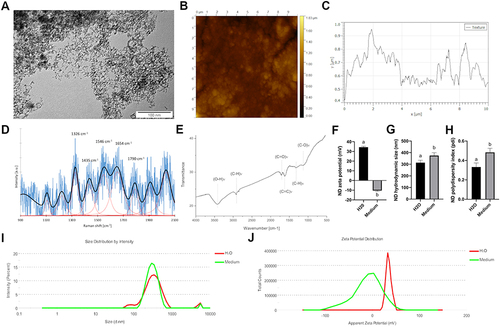
Figure 2 Diamond nanoparticles are cytotoxic to HUVEC but not to HS-5 and HMEC. HUVEC, HS-5, and HMEC 48-h proliferation (A) and 24-h membrane perforation (B) after treatment with NDs at concentrations of 5, 10, 20, 50, and 100 μg/mL. Statistical significance is indicated with asterisks: *P < 0.033, **P < 0.002, ***P < 0.001 (multifactor ANOVA; P < 0.05; n = 3 with 4 individual replicates for proliferation and 6 individual replicates for membrane perforation). All values are expressed as mean ± standard deviation. (C) HUVEC metabolic activity after treatment with NDs at concentrations of 5, 10, 20, 50, and 100 mg/l for 24 h. Statistical significance is indicated with different superscripts: P<0.001 (a, b, c, d, e) (ANOVA; P < 0.05; n = 3 with 6 individual replicates). (D) Live/Dead assay confocal microscopy images of nontreated HUVEC cells (“C”) and treated cells with 50 mg/l for 24 h (“ND”). The nuclei of dead cells are labelled with a green stain (NucGreen Dead 488), whereas all nuclei are stained with a red stain (NucRed Live 647). Images taken using Nomarski interference contrast (“NOM”) showed light-reflecting nanoparticle agglomerates, suggesting strong endocytosis of NDs.
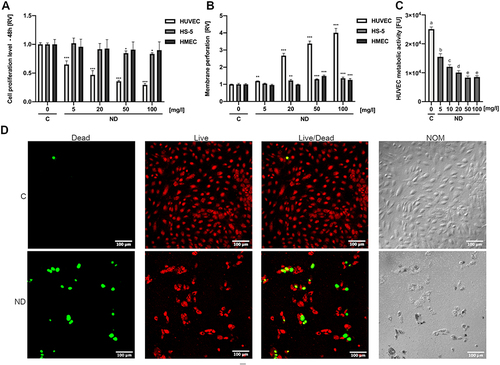
Figure 3 Toxicity of diamond nanoparticles to HUVEC depends on cell density and surface conjugation of nanoparticles. (A) HUVEC 48-h proliferation was analysed for untreated cells (“C”) or cells treated with NDs (“ND”, “-RGD -FBS”) and NDs conjugated with a peptide containing an RGD motive (Gly-Arg-Gly-Asp-Ser; “ND”, “+RGD”) and at concentrations of 5 and 50 mg/l in standard HUVEC culture medium and in medium with the addition of 10% FBS (“+FBS”). Statistical significance is indicated with different superscripts: P<0.001 (a, b, c, d, e) (ANOVA; P < 0.05; n = 3 with 4 individual replicates). (B) Dependence of ND toxicity on HUVEC cell density was assessed in a 96-well plate at densities of 5 x 10³, 1 x 10⁴, 1.5 x 10⁴, and 2×10⁴. After 24-h incubation, cells were treated with NDs at a concentration of 0.4 ng/cell (the final ND concentration was 20, 40, 60, and 80 mg/L in 100 µL medium, respectively), and the metabolic activity was assessed. The relative toxicity of HUVEC was expressed as the ratio of the metabolic activity value of the ND-treated cells to the metabolic activity of the untreated cells. Statistical significance is indicated with different superscripts: P<0.001 (a, b, c, d) (ANOVA; P < 0.05; n = 3 with 6 individual replicates). All values are expressed as mean ± standard deviation. (C) HUVEC time-lapse images of a 12-h cell culture with NDs at a final concentration of 20 mg/l. The full video of time-lapse images is available as Supplementary Video. Abbreviations: RV, relative value; FUs, fluorescent units; C, control; NDs, diamond nanoparticles; RGD, Gly-Arg-Gly-Asp-Ser peptide; FBS, fetal bovine serum. (D) HUVEC spheroid morphology after 24-h treatment with NDs at a concentration of 10 and 100 mg/l. HUVEC spheroid membrane perforation (E) and spheroid size (F) for a after 24-h incubation with NDs at a concentration of 5, 10, 20, 50, and 100 mg/l. Statistical significance is indicated with different superscripts:: P<0.001 (a, b, c) (ANOVA; P < 0.05; n = 3 with 6 individual replicates).
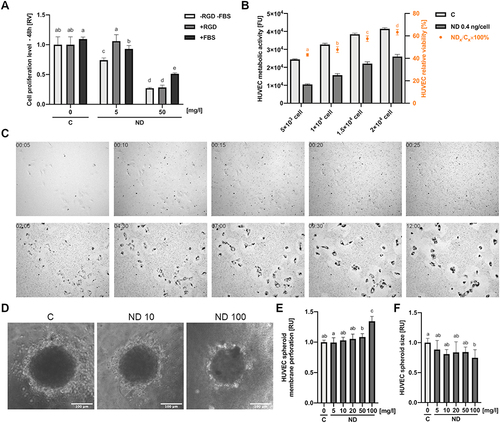
Figure 4 Diamond nanoparticles led to an NADPH-dependent induction of ROS in HUVEC. (A) Intercellular level of NADPH analysed in lysates of control HUVEC cells (“C”) and HUVEC cells incubated for 4 h with NDs at a concentration of 20 and 50 mg/l (“ND”). Statistical significance is indicated with different superscripts: P<0.001 (a, b, c) (ANOVA; P < 0.05; n = 2 with 4 individual replicates). (B) Merged images of mitochondrial superoxide staining (red channel; MitoSox Red, Thermo Fisher Scientific) and transmitted light with Nomarski interference contrast of control HUVEC cells (“C”) and HUVEC cells incubated for 4 h with NDs at a concentration of 50 mg/l (“ND 50”). (C) Confocal images of ROS and NO in control HUVEC cells (“C”) and HUVEC cells incubated for 4 h with NDs at a concentration of 20 and 50 mg/l (“ND 20”, “ND 50”) detected using the general oxidative stress indicator CM-H2CFDA (green channel; Thermo Fisher Scientific) and the NO synthesis level indicator DAF-FM (green channel; Thermo Fisher Scientific). Cell nuclei were stained with NucRed Live 647 (red channel; Thermo Fisher Scientific). Graphs showing ROS (D) and NO (E) levels expressed as a sum of the pixel values per cell. Statistical significance is indicated with different superscripts: P<0.001 (a, b) (ANOVA; P < 0.05; n = 2 with 7 individual replicates, and each well was imaged in 4 fields of view). All values are expressed as mean ± standard deviation.
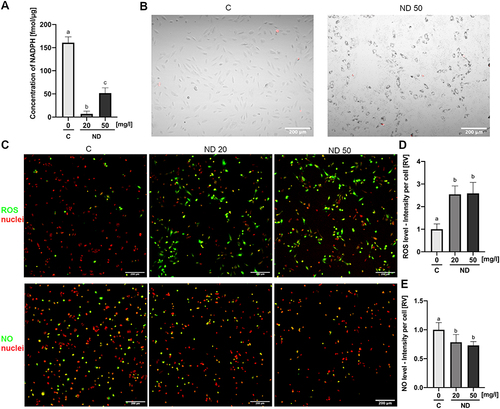
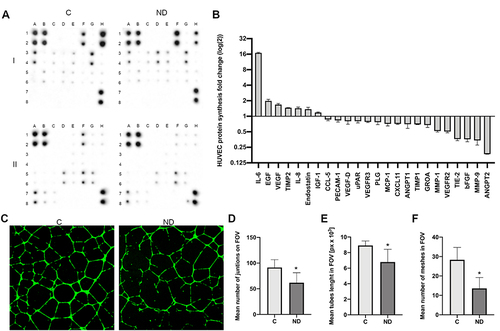
Figure 5 NDs increase the synthesis level of stress-related proteins. (A) Antibody array analysis of cytokine synthesis in control HUVEC cells (“C”) incubated with NDs at a concentration of 20 mg/l for 24 h (“ND”). One assay consists of two membranes, which are labelled “I” and “II”, and the proteins are analysed in duplicate. The localization of the positive controls: I_A1,2; I_B1,2; I_H7,8; II_A1,2; II_B1,2; II_H7,8. The localization of the selected proteins in the order of their fold (log(2)) change shown in the graph (B): IL-6, I_D3,4; EGF, I_F1,2; VEGF, I_G5,6; TIMP2, I_E5,6; IL-8, I_E3,4; endostatin II_H1,2; IGF-1, I_C3,4; CCL-5, I_B5,6; PECAM-1, II_F5,6; VEGF-D, I_H5,6; uPAR, II_A7,8; VEGFR3, II_C7,8; PLG, II_G1,2; MCP-1, I_G3,4; CXCL11, II_A5,6; ANGPT1, II_E1,2; TIMP1, I_D5,6; GRO A, I_A1,2; MMP-1, II_D5,6; VEGFR2, II_B7,8; TIE-2, II_G5,6; bFGF, I_H1,2; MMP-9, II_E5,6; ANGPT2 II_F1,2. The full array map is available in Tables S1 and S2. (C) Images of control HUVEC tube formation (“C”) and tube formation during treatment with NDs at a final concentration of 20 mg/l (“ND”). Graphs show the mean number of junctions of HUVEC tubes in the field of view (D), mean tube length in the field of view (E), and mean number of meshes in the field of view (F). Data were obtained by analysing the images using ImageJ software and the Angiogenesis Analyzer macro. Statistical significance is indicated with asterisks: *P = 0.003, P = 0.002 and P < 0.001, respectively (t-test; P < 0.05; n = 2 with 4 individual replicates). All values are expressed as mean ± standard deviation.
Data Sharing Statement
The datasets analyzed during the current study are available from the corresponding author on reasonable request.