
Figures & data
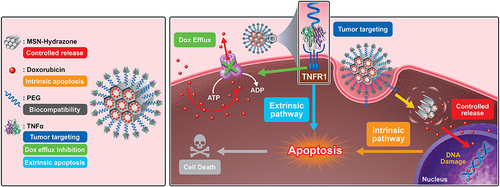
Scheme 1 Schematic illustration of construction of MSN-Dox-TNFα that down-regulates the expression of P-gp, facilitating targeted uptake in drug-resistant cancer cells. Intracellular release of Dox through cleavage of hydrazone bonds results in abundant accumulation, which significantly reduces cell viability through both intrinsic and extrinsic apoptosis pathways.
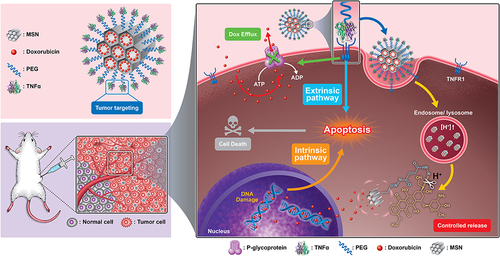
Figure 1 Characterization of the synthesized nanomaterials. (a) TEM photos of MSN and MSN-PEG. Scale bars: 100 nm. (b) FTIR spectra of MSN, Dox, PEG and MSN-Dox-TNFα. (c) DLS diameter and zeta potential changes after functionalization. (d) Dox release profiles at various pH values.
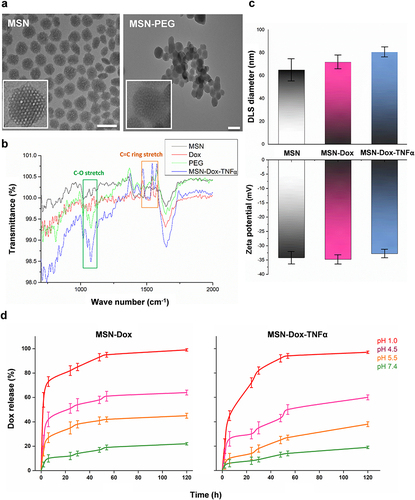
Figure 2 In vitro cellular uptake of free Dox, MSN-Dox, or MSN-Dox-TNFα at various time points were visualized by confocal microscopy in MES-SA/Dx5 cells incubation time (a) 2 h and (b) 24 h with 50 μg/mL NP or 0.4 μg/mL Dox. Dox showed red fluorescence. Lysosomes stained with lysotracker green probe. Nucleus was stained by DAPI. Note the higher level of MSN-Dox-TNFα uptake, and the colocalization of the MSN within the lysosomes. Colocalization of Dox within the nucleus (indicated by white arrow) after 24 h post-treatment. Scale bars: 20 μm.
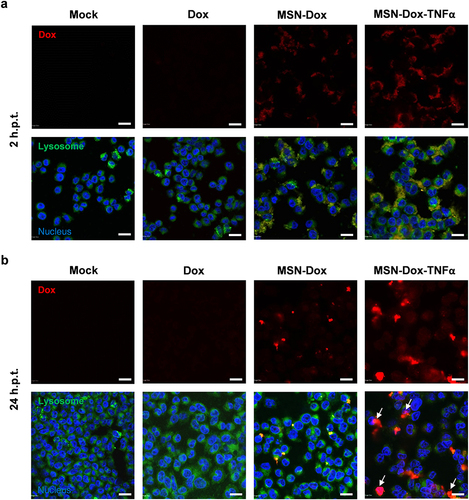
Figure 3 Evaluation of cell viability of MES-SA/Dx5 cells in the presence of different NP. (a) Cytotoxic effects of Dox or MSN on MES-SA or MES-SA/Dx5 seeded with a density of 5×10⁴ cells in 100 μL medium incubated with Dox only (0.4 or 5 μg/mL) or 50 μg/mL MSN. Data are the mean±SEM expressed as viability percentage relative to mock. *P<0.05 vs mock. (b) Combination treatment with Dox and TNFα on MES-SA/Dx5 cell line. (c) Seeded MES-SA/Dx5 cells were incubated with Dox (0.4 μg/mL) or different NP (50 μg/mL). Cell viability was quantified at various time points. Data are the mean±SEM expressed as viability percentage relative to mock. *P<0.05 at each time points.
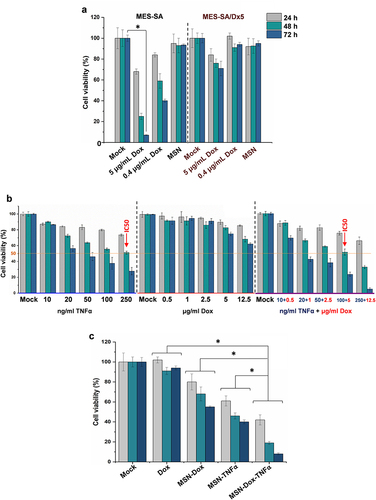
Figure 4 Caspase activity analysis of expression levels of apoptotic protein by MES-SA/Dx5 cells treated with different NP after 2, 6, 12, 24, or 48 h. The level of activated caspase-3, activated caspase-9, or full-length caspase-8 was analyzed by (a) Western blot analysis or (b) multiplex activity assay kit (Abcam). There was an increase of activated caspase-3 and caspase-9, and a decrease of full-length caspase-8, that were obviously more pronounced in the MSN-Dox-TNFα group than the other treatments. Data are the mean±SEM expressed as fold-change related to mock. *P<0.05.
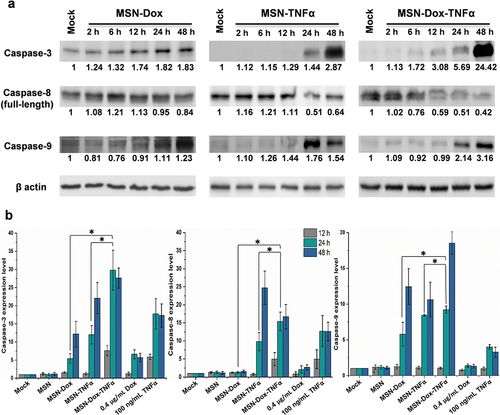
Figure 5 P-gp expression inhibited by MSN-TNFα treatment in MES-SA/Dx5 cells. (a) RT-PCR and (b) Western blot analysis of P-gp expression level. Amplification of GAPDH was used as a control for RT-PCR assays. For loading control in the Western blot assay, the membrane was incubated with anti-β actin antibody. (c) MES-SA (Dox-sensitive) or Dox-resistant counterpart cells were treated with free Dox and analysis of uptake of Dox by flow cytometry. Gray line: mock, red line: free Dox (6 h.p.t.), blue line: free Dox (24 h.p.t.) and green line: free Dox (48 h.p.t.). (d) MSN-TNFα increases tumor cell uptake of Dox by inhibiting P-gp expression. Green line: Free Dox treatment without MSN-TNFα pretreatment, red line: MSN-TNFα 48 h.p.t. then treat with MSN-Dox or free Dox (blue line).
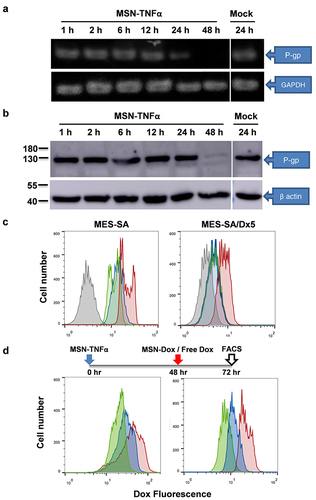
Figure 6 Impact of Dox uptake on MSN-Dox-TNFα treatment in 3D u87MG cell spheroids. U87MG cells were grown as 3D spheroids, and treated with Dox (0.4 or 5 μg/mL), MSN-Dox, or MSN-Dox-TNFα. The nuclei were stained by DAPI (blue fluorescence), and red fluorescence signals were from Dox. 3D cell spheroids were fixed at (a) 24 h or (b) 48 h post-treatment. (b) It also shown the images along z-axis to demonstrate the penetration ability of NP. Fluorescence images were obtained with confocal microscopy at the indicated time points. Scale bars: 100 μm.
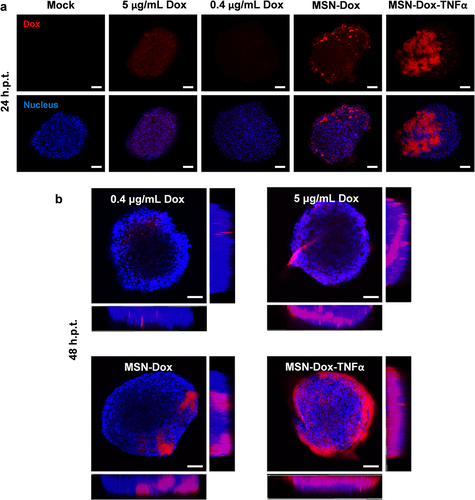
Figure 7 Tight junction staining (green) revealed an obvious effect of MSN-Dox-TNFα on 3D cell spheroids compared to free Dox or NP treatment. The sonicated cell spheroids as the positive control to mimic the leakage of the cell-cell tight junction. Scale bars: 25 μm.
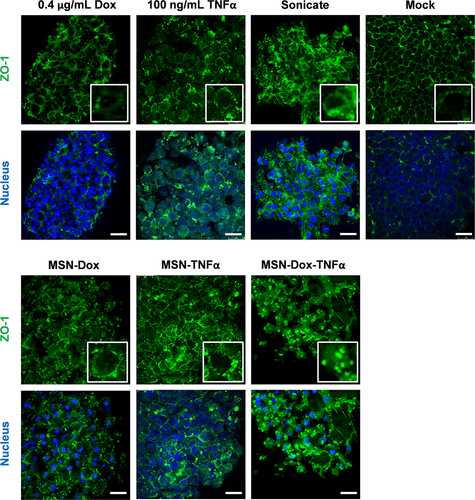
Figure 8 In vivo combination therapy effect of MSN-Dox-TNFα. MES-SA/Dx5 tumor–bearing mice were treated (i.t.) at Day 0 when the tumor volume reached 100 mm3 with MSN (50 μg/mL), TNFα (100 ng/mL), Dox (0.4 μg/mL), MSN-Dox, MSN-TNFα, and MSN-Dox-TNFα (50 μg/mL). (a) Tumor volume and (b) body weight changes during the treatment. Data are the mean±SEM expressed as the fold-change of tumor volume relative to V0. *P<0.05. (c) Immunofluorescence staining of activated caspase-3 expression (green) in tumor tissues after treatments. Scale bars: 100 μm.
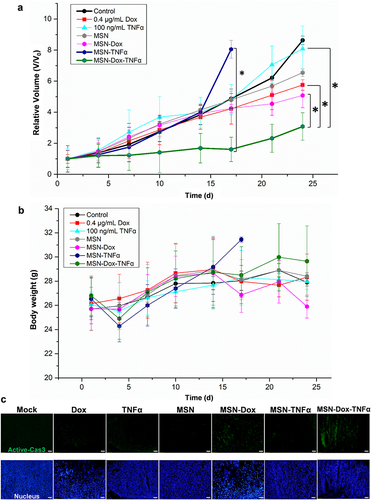
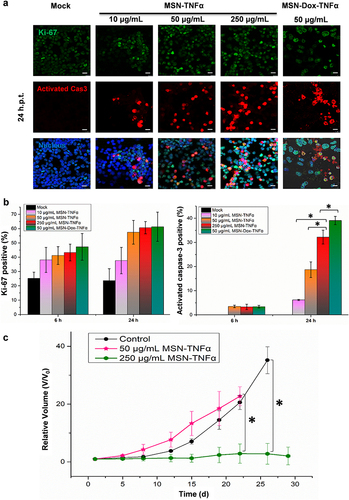
Figure 9 Double immunofluorescence staining of Ki-67 and activated caspase-3. After 6 and 24 h incubation, the MES-SA/Dx5 cells (1x10⁶ cells/mL) were fixed and stained with DyLight 488 for Ki-67 (green), and DyLight 594 for activated caspase-3 (red). (a) Distribution of Ki-67 and activated caspase-3 in cells incubated with MSN-TNFα at 10, 50, or 250 μg/mL, or MSN-Dox-TNFα at 50 μg/mL. Scale bars: 10 μm. (b) A percentage of Ki-67-positive cells or activated caspase-3 positive cells were fixed at 6 or 24 h post NP treatment. These were cumulative results of three independent experiments. Date are expressed as mean±SEM, *P<0.05. (c) Profiling of tumor growth in vivo under the treatments of MSN-TNFα at different concentrations. MES-SA/Dx5 tumor–bearing mice were treated (i.t.) at Day 0 when the tumor volume reached 100 mm3 with a standard dose of MSN-TNFα (50 μg/mL) or a high dose of MSN-TNFα (250 μg/mL). Data are the mean±SEM expressed as the fold-change of tumor volume relative to V0. *P<0.05.
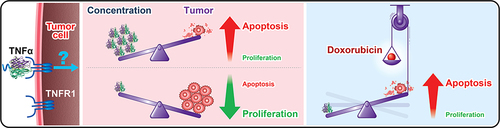
Scheme 2 Schematic illustration of the concentration-dependent bi-functional effect of TNFα in the modulation of proliferation and apoptosis in vivo. The combination of Dox and TNFα could significantly inhibit tumor growth via both intrinsic and extrinsic apoptosis pathways.
Data Sharing Statement
All data generated or analyzed during this study are included in this manuscript.