Figures & data
Figure 1 Preparation and characterization of the CLP/siRNA complex. (A) Preparation strategy. (B) Size distribution of CLP detected by particle sizer. (C) Zeta potential of CLP. (D) Transmission electron microscopy image of CLP. (E) Gel retardation assay of the CLP/siRNA complex. (F) siRNA degradation assay by agarose gel electrophoresis.
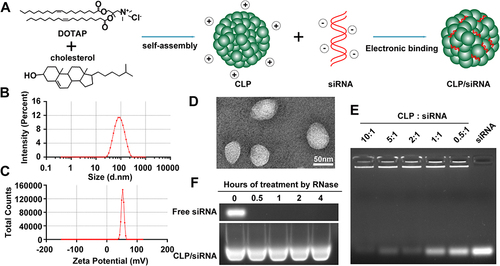
Figure 2 CLP could efficiently deliver siRNA in vitro through clathrin-mediated endocytosis. (A) Laser confocal scanning microscope images of PMs cells transfected different vectors coated with siRNAFAM (green channel) and stained cell nuclei with DAPI (blue channel). (B) FCM for the transfection efficiency of CLP/siRNAFAM complex for different mass ratios. (C) FCM for the transfection efficiency of different vectors delivering siRNAFAM for 48 hours. (D) CCK-8 analysis of the cell viability of PMs treated with different vectors for 48 hours. (E and F) CCK-8 analysis of the cell viability of PMs (E) and RAW264.7 (F) transfected with different concentrations of CLP and PEI. (G and H) RT-PCR (G) and WB (H) for NLRP3 levels in PMs transfected for 48 hours with CLP/siNLRP3 or CLP/NC and then stimulated with LPS. (I–K) FCM (I and J) and Laser confocal scanning microscope images (K) for PMs cells treated with cellular uptake inhibitor before transfection with CLP/ siRNAFAM. Data were mean± SEM. *P ≤ 0.05, **P ≤ 0.01, ***P ≤ 0.001.
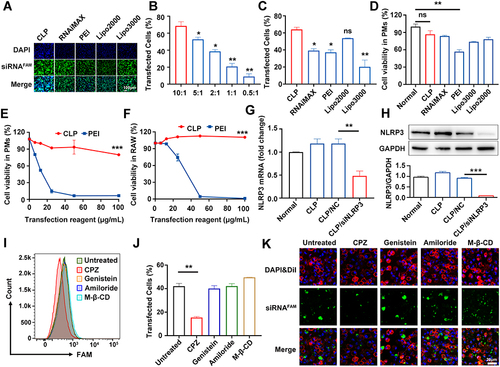
Figure 3 CLP/siNLRP3 could efficiently inhibit the activation of NLRP3 inflammasome in vitro. PMs were transfected with CLP/siNLRP3 for 48 hours and then stimulated with LPS and nigericin. Subsequently, the culture supernatants (SN) and lysates (Lys) were subjected to the following operations. (A) WB analysis of matured IL-1β (P17) and cleaved caspase-1 (P20) in SN, and pro-IL-1β and pro-caspase-1 in Lys. (B–D) ELISA of IL-1β (B), IL-18 (C), and TNF-α (D) in SN. (E) Immunofluorescence of ASC specks in PMs. The red channel represented ASC, and the blue channel represented DAPI. (F) WB of ASC oligomerization in Lys of PMs. Data were mean± SEM. **P ≤ 0.01, ***P ≤ 0.001.
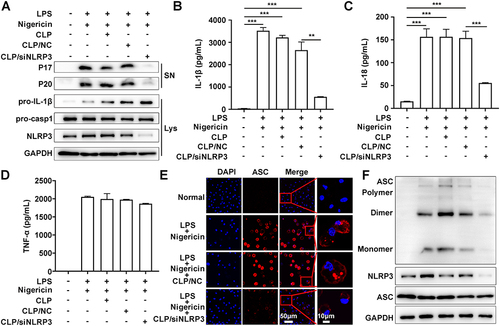
Figure 4 CLP/siNLRP3 could effectively alleviate DSS-induced UC in mice. (A) The schematic of the dosing regimen of CLP/siNLRP3 and DSS-induced UC. (B and C) Body weight loss (B) and DAI (C) in mice with DSS-induced UC. (D and E) Photographs of the colon (D) and its length statistics (E) in mice with DSS-induced UC. (F and G) HE staining (F) and histopathology score (G) of frozen sections of the colon in mice with DSS-induced UC (n=6 per group). Data were mean± SEM. *P ≤ 0.05, ***P ≤ 0.001.
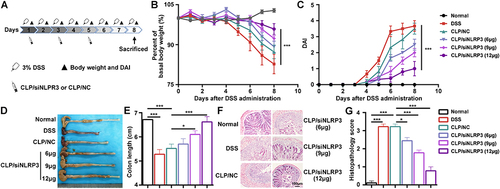
Figure 5 CLP/siNLRP3 alleviated DSS-induced UC by inhibiting NLRP3 inflammasome activation. (A and B) The gene levels of pro-IL-1β (A) and NLRP3 (B) in colonic tissue detected by RT-PCR. (C and D) The protein level of mature IL-1β (C) and TNF-α (D) in colonic tissue detected by ELISA. (E) WB analysis of IL-1β, caspase-1, and NLRP3 in colonic tissue. (F) Immunofluorescence detection of F4/80+ macrophages (red) in frozen sections of colonic tissue (n=6 per group), nuclei were stained with DAPI (blue). Data were mean± SEM. *P ≤ 0.05, **P ≤ 0.01, ***P ≤ 0.001.
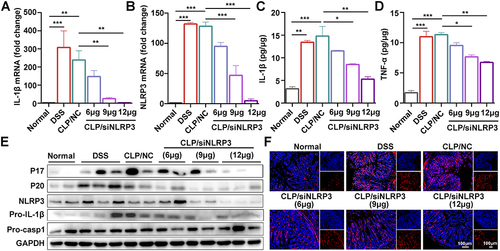
Figure 6 CLP/siNLRP3 modulated macrophage polarization and down-regulated CD4+ T cell production. (A) The schematic diagram of macrophage detection by FCM. (B) The percentage of macrophages in peripheral blood, spleen, and mLNs detected by FCM. (C and D) The percentage of M1 (C) and M2 (D) macrophages in the mLNs and spleen detected by FCM. (E) The schematic diagram of T cells and T cell subtypes detection by FCM. (F–H) The percentage of CD3+ (F), CD4+ (G), and CD8+ T cells (H) in peripheral blood, spleen, and mLNs detected by FCM. N=6 per group, data were mean± SEM. *P ≤ 0.05, **P ≤ 0.01, ***P ≤ 0.001.
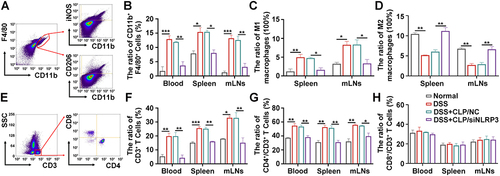
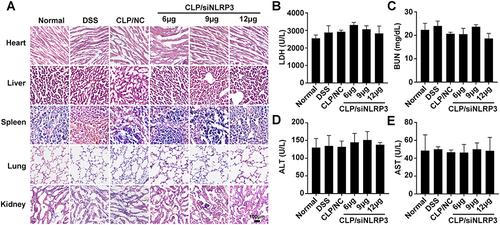
Figure 7 CLP/siNLRP3 had no significant side effects in vivo. (A) HE staining of frozen sections of major organs (heart, liver, spleen, lung, and kidney) in mice with DSS-induced UC. (B–E) The levels of LDH (B), BUN (C), ALT (D), and AST (E) were detected with blood biochemistry to assess cardiac (LDH), kidney (BUN) and liver (ALT and AST) function, respectively. N=6 per group, data were mean± SEM.