Figures & data
Figure 1 TEM images of (A) Au nanostar, (B) Au@Ag NS, (C) Au@AgAu YSNS (D) Ultraviolet spectra of Au nanostar, Au@Ag NS, Au@AgAu YSNS.(E) The SERS performance of Au NS, Au@Ag core-shell nanostructure and Au@Ag YSNS using CV (10−6 M) as probe molecule.
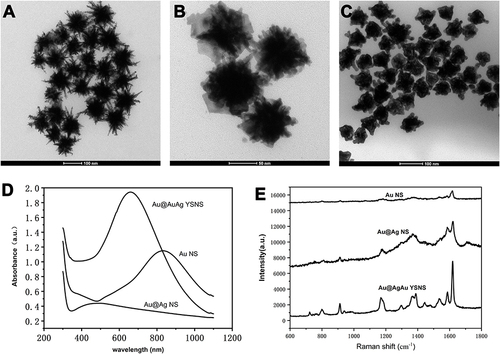
Table 1 The Calculated CYPA Concentration in Human Serum Using SERS Methods
Figure 2 (A) The SERS spectra of Au@Ag@Au@CV@SiO2 with different CV concentrations. (B) Raman spectra of Au@AgAu@CV@SiO2 SERS probe (CV, 10−4 M) with different volume ratio of antigen (0.01 μg/mL, 100 μL) to Au@Ag@Au@CV@SiO2 solution (400 μg/mL). (C) Raman spectra of different concentrations of CYPA. (D) Relationship between the negative logarithm of human serum CYPA concentration and peak height.
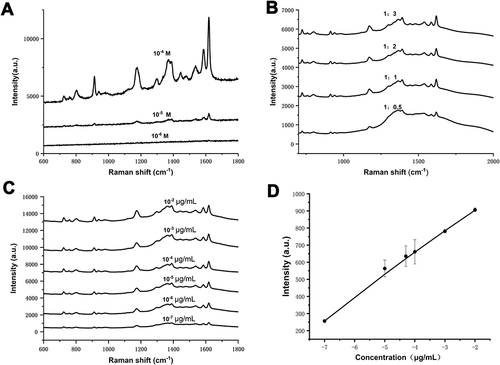
Figure 3 (A)Thermal infrared images of different concentrations of Au@AgAu YSNS (20, 50, 100, 200 μg/mL). (B) Heating curves of Au@AgAu YSNS at different concentrations (20,50,100,200 μg/mL) under an 808-nm laser irradiation (1 W cm−2) with. (C) Temperature changes exhibited during five heating and cooling cycles (100μg /mL, 1 W cm−2). (D) Heating-cooling curves of Au@AgAu YSNS (100μg /mL, 1 W cm−2). (E) The linear relationship of time data versus −ln θ obtained from the cooling period of picture.
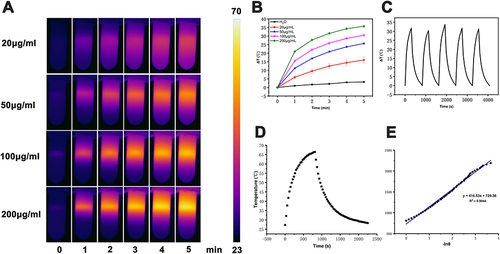
Figure 4 (A) Cell viability of normal ovarian cells incubated with different concentrations of nanomaterials for 24h. (B) Cell viability of A2780 ovarian cancer cells in different groups (the concentrations of nanomaterials is 50 μg/mL). (C) Calcein-AM and propidium iodide staining images of different groups A2780 ovarian cancer cells.
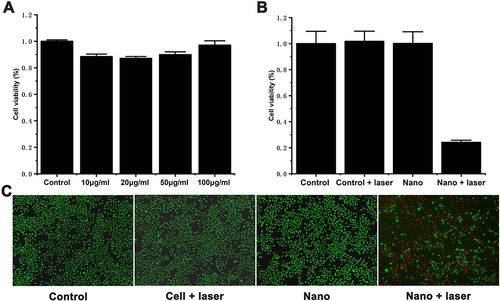
Figure 5 (A) Thermal infrared images of mice in control group and nano+laser (50 μg/mL, 808nm,1.5 W/cm2, 5min). (B) Photographs of the tumors (n=3) that taken on the seventh day. (C) The curves of tumor weight (n = 3) for each experimental group. (D) The curves of tumor volume (n = 3) for each experimental group.
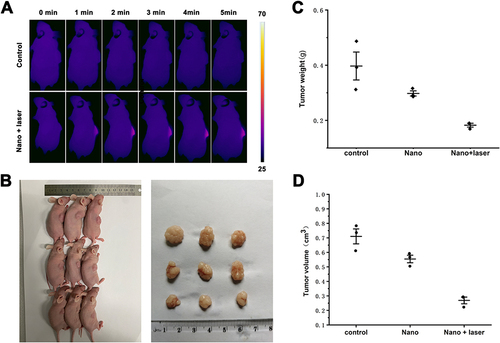
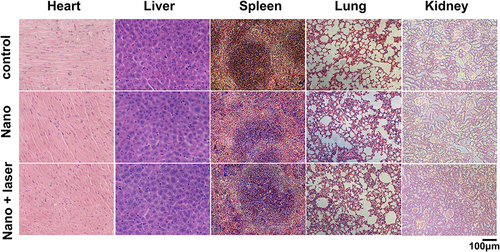
Figure 6 H&E staining after Au@AgAu@CV@SiO2 injected into each organ of mice.