
Figures & data
Figure 1 Fabrication of a pH-responsive nanocomposite-based colonic delivery system to improve the oral absorption of liraglutide.
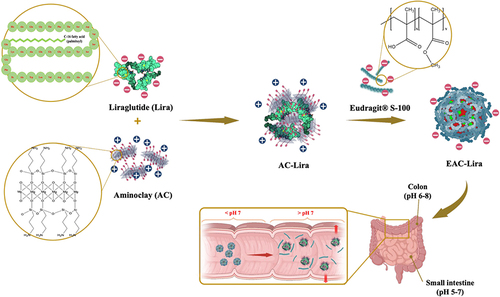
Table 1 Characteristics of Nanoparticles (Mean ± SD, n = 3)
Figure 2 In vitro characterization of aminoclay-based nanoparticles. (A) Size distribution of nanoparticles, (B) FT-IR spectra, (C) TEM images. Scale bar is 200 nm for AC-Lira and 500 nm for EAC-Lira, (D) CD spectra (left) and HPLC chromatograms (right) of liraglutide released from each formulation after incubation at pH 7.4 for 8 h.
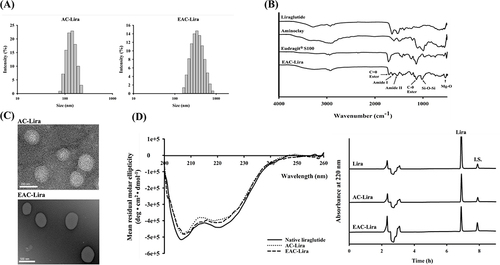
Figure 3 In vitro drug release profiles of the uncoated (AC-Lira) and coated (EAC-Lira) nanoparticles at pH 1.2 (A) and at pH 7.4 (B) (mean ± SD, n = 3).
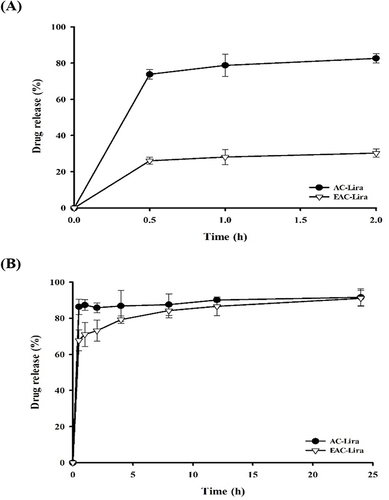
Figure 4 Variation in particle size (A), zeta potential (B), and PDI (C) during the incubation of EAC-Lira at different pH values (mean ± SD, n = 3).
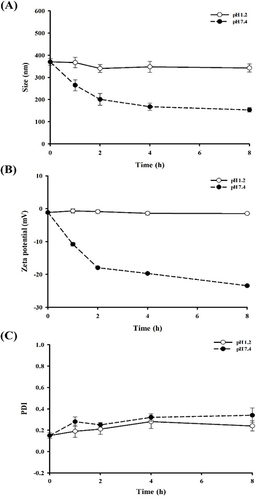
Figure 5 CD spectra of liraglutide released from the nanoparticles after incubation in SGF (A) and SIF (B). At the end of incubation in SGF and SIF, the nanoparticles were collected and incubated in PBS (pH 7.4). The released liraglutide underwent CD spectroscopic analysis.
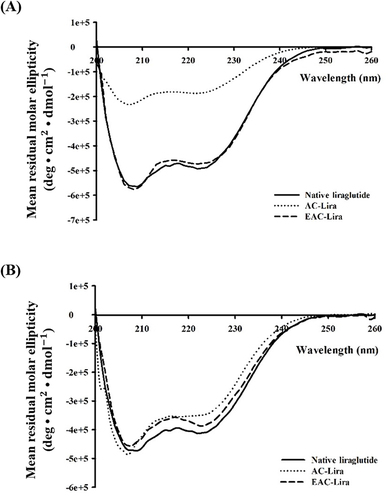
Figure 6 Cellular transport of liraglutide in different formulations (mean ± SD, n = 4). (A) Apparent permeability of liraglutide from different formulations, and (B) the effect of each formulation on the trans-epithelial electrical resistance (TEER). *p < 0.05, compared to the control (liraglutide solution).
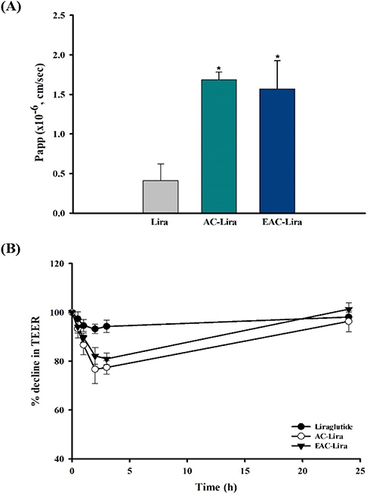
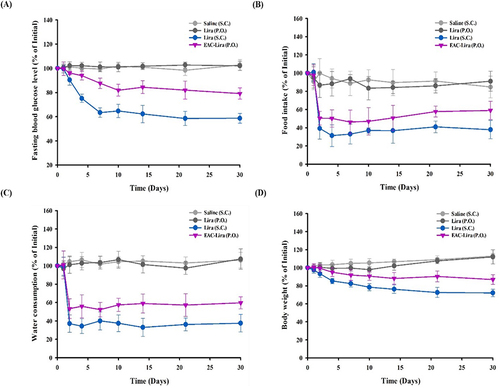
Figure 7 In vivo efficacy of EAC-Lira in type 2 diabetic rats (mean ± SD, n = 5–6). The in vivo effect on blood glucose level (A), food intake (B), water consumption (C), and body weight (D) was assessed after once-daily dosing of each formulation for 30 days. The dose was equivalent to 0.3 mg/kg and 15 mg/kg of liraglutide, for SC injection and oral administration, respectively.
Data Sharing Statement
All data generated or analyzed during this study are included in this published article.