Figures & data
Figure 1 Characterization of fluorescent probes. ((A) SM (1.25×, Scale bars = 500 μm); (B) PM (4×, Scale bars = 100 μm); (C) SEM (25×, Scale bars = 400 μm); (D) SEM (500×, Scale bars = 20 μm) (1: Rh-NPs-DMNs; 2: Rh-DMNs).
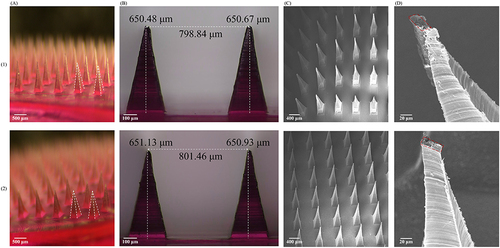
Figure 2 Characterization of Rh-NPs. ((A) variation in particle size; (B) appearance properties; (C) particle size distribution; (D) zeta potential; (E) TEM (28×, Scale bars = 200 nm)).
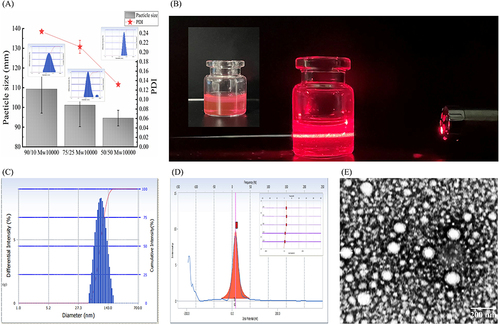
Figure 3 Characterization of Rh-NPs-DMNs (1) and Rh-DMNs (2). ((A) local fracture force at the tip; (B) overall fracture force; (C) the trend of puncture (points indicate Mean ± S.D.) (n = 3 independent experiments with three technical replicates); (D) perforation changes in each layer of membrane)(1: Rh-NPs-DMNs; 2: Rh-DMNs).
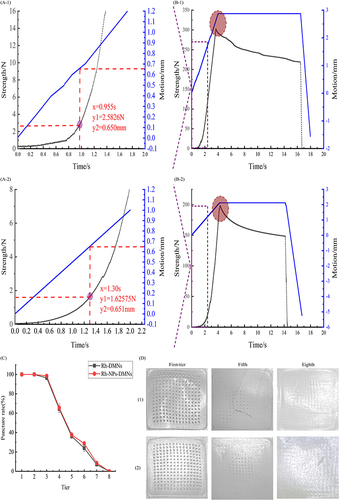
Figure 4 (A) Fluorescence signal intensity distribution at different time points; (B) Fluorescence signal intensity distribution of major organs; (C) Organ collection of fluorescent signals; (D) Hippocampus collection of fluorescent signals. (Bars indicate mean ± S.D.) (n = 3 independent experiments with three technical replicates) (nsP > 0.05; *P ≤ 0.05, **P < 0.01) (1: Rh-NPs-DMNs; 2: Rh-DMNs; 3: blank controls).
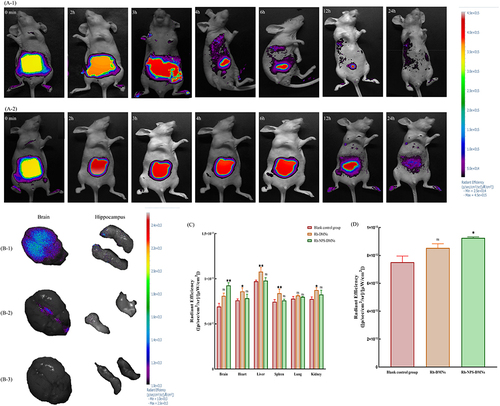
Figure 5 Morphological changes within 10 min of microneedle puncture into isolated rat abdominal skin. (4×, Scale bars = 200 μm)(1: Rh-NPs-DMNs; 2: Rh-DMNs).
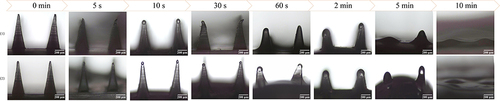
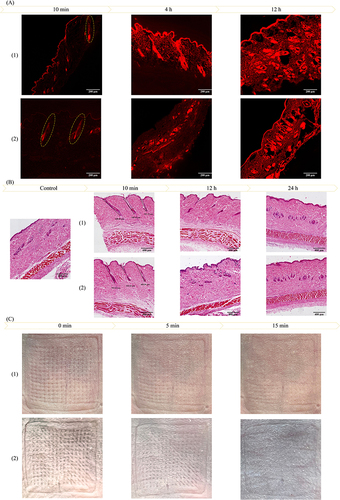
Figure 6 (A) Changes in fluorescence intensity and depth of skin at different time points (10×, Scale bars = 200 μm) and safety evaluation. (B) Tissue section results (5×, Scale bars = 400 μm); (C) Healing at the microneedle administration site; 1: Rh-NPs-DMNs; 2: Rh-DMNs).