
Figures & data
Figure 1 (A) Structure of the MemBrightTM markers. (B) Absorption and emission spectra of MemBrightTM probes (200 nM) in the absence (dashed lines) or presence of DOPC vesicles. (C) Turn-on mechanism of the MemBrightTM probes. (A)-(C) Reprinted from Cell Chem Biol, 26(4), Collot M, Ashokkumar P, Anton H, et al. MemBright: a family of fluorescent membrane probes for advanced cellular imaging and neuroscience. 600–614 e7, Copyright (2019), with permission from Elsevier.Citation20 (D) Confocal images of MemBright-Cy3 labeled Zmel1 EVs 3 hpi in Tg (mpeg1: GFP) (macrophage specific expression). Reprinted from Dev Cell, 48(4), Hyenne V, Ghoroghi S, Collot M, et al. Studying the fate of tumor extracellular vesicles at high spatiotemporal resolution using the zebrafish embryo. 554–572 e7, Copyright (2019), with permission from Elsevier.Citation21
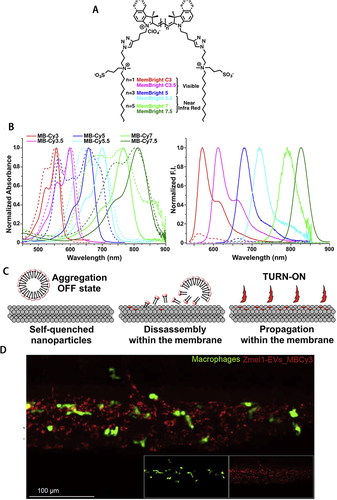
Figure 2 (A) Scheme of the fluorescence labelling method of sEVs surface using copper-free click chemistry with AlexaFlour®488 (AF488)-azide. Reprinted from Xu L, Faruqu FN, Liam-Or R, et al. Design of experiment (DoE)-driven and uptake studies of exosomes for pancreatic cancer delivery enabled by copper-free click chemistry-based labelling. J Extracell Vesicles. 2020;9(1):1779458. © 2020 The Author(s). Published by Informa UK Limited, trading as Taylor & Francis Group on behalf of The International Society for Extracellular Vesicles. Creative Commons.Citation42 (B)Combination the metabolic labeling of newly synthesized proteins or glycan/glycoproteins of exosome-secreting cells with chemically active azide groups and biorthogonal click conjugation to modify and functionalize sEVs. Reprinted from Wang M, Altinoglu S, Takeda YS, Xu Q. Integrating Protein Engineering and Bioorthogonal Click Conjugation for Extracellular Vesicle Modulation and Intracellular Delivery. PLoS One. 2015;10(11):e0141860. Creative Commons.Citation43
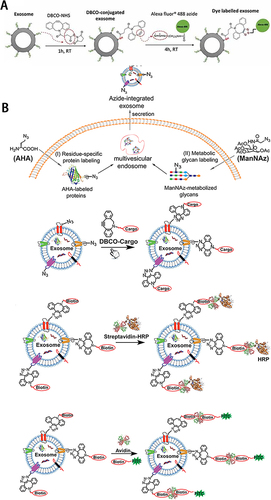
Figure 3 (A) Schematic illustration of indirect IF labeling of CD63 and sEVs membrane stained with CM-Dil. Reprinted with permission from Chen C, Zong S, Wang Z, et al. Imaging and Intracellular Tracking of Cancer-Derived Exosomes Using Single-Molecule Localization-Based Super-Resolution Microscope. ACS Appl Mater Interfaces. 2016;8(39):25825–25833. Copyright © 2016 American Chemical Society.Citation46 (B) Schematic of aptamer-based DNA nanoassemblies on the surfaces of sEVs. Reprinted with permission from Wan S, Zhang L, Wang S, et al. Molecular Recognition-Based DNA Nanoassemblies on the Surfaces of Nanosized Exosomes. J Am Chem Soc. 2017;139(15):5289–5292. Copyright © 2017 American Chemical Society.Citation48 (C) Schematic illustration of screening for sEVs anchor peptides and functionalization on sEVs. Reprinted from Gao X, Ran N, Dong X, et al. Anchor peptide captures, targets, and loads exosomes of diverse origins for diagnostics and therapy. Sci Transl Med. 2018;10:444. Creative Commons.Citation49
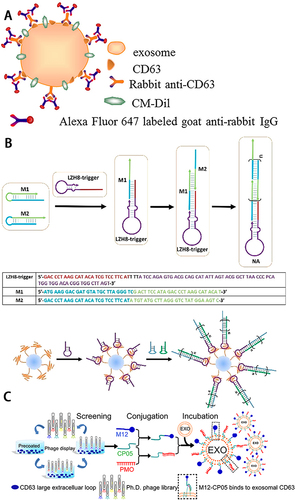
Figure 4 (A) Determination of phase of tumor cell invasion around desmoplasia by EVs distribution. (B) Intraoperative label-free multimodal imaging system. (A) and (B) Reprinted from Sun Y, You S, Tu H, et al. Intraoperative visualization of the tumor microenvironment and quantification of extracellular vesicles by label-free nonlinear imaging. Sci Adv. 2018. Creative Commons.Citation119 (C)In vivo visualization of EVs from cancer tissue in rat mammary tumors by label-free multiphoton microscopy. Reprinted from You S, Barkalifa R, Chaney EJ, et al. Label-free visualization and characterization of extracellular vesicles in breast cancer. Proc Natl Acad Sci U S A. 2019;116(48):24012–24018. Creative Commons.Citation120 (D) EVs cluster distribution in rat mammary tissues by K-means clustering of CARS spectra. Reprinted with permission from © The Optical Society. Sun Y, Chen EW, Thomas J, Liu Y, Tu H, Boppart SA. K-means clustering of coherent Raman spectra from extracellular vesicles visualized by label-free multiphoton imaging. Opt Lett. 2020;45(13):3613–3616.Citation121
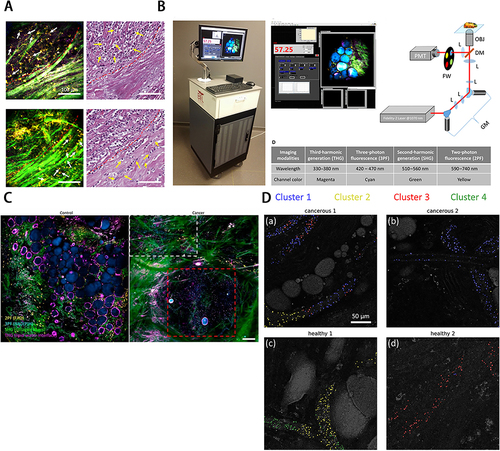
Table 1 Fluorescent Labeling Techniques of sEVs Imaging
Table 2 Non-Fluorescent Labeling Techniques of sEVs Imaging