Figures & data
Figure 1 Characterization of Gd@BSA NPs. (a) Hydrodynamic diameter of Gd@BSA NPs determined by DLS. And TEM image of Gd@BSA NPs; red dotted circles indicate nanoparticles. (b) UV‒vis absorption spectra of BSA and Gd@BSA NPs. (c and d) Energy-dispersive X-ray spectroscopy (EDX) and elemental analysis performed on Gd@BSA NPs. EDX spectrum, and corresponding elemental mapping for nitrogen (N), oxygen (O), sulfur (S), gadolinium (Gd). (e and f) TEM images of Gd@BSA NPs in H2O and FBS, respectively. (Red circles: locations of Gd@BSA NPs). (g) T1-weighted MR images of Gd@BSA NPs and Gd-DTPA at different Gd concentrations. (h) Analysis of the longitudinal relaxation rates r1 (1/T1) of Gd@BSA NPs and Gd-DTPA. T1 relativity was calculated from the slopes of the best fit lines of the experimental data.
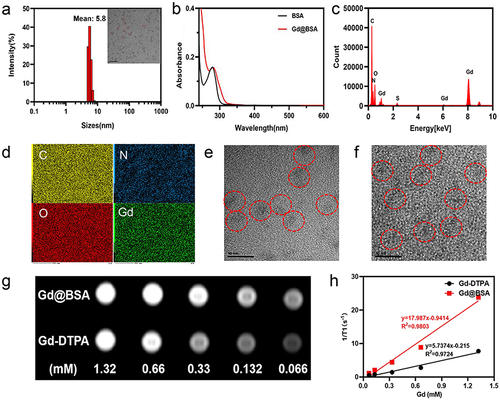
Figure 2 In vivo MR angiography of the Gd@BSA NP contrast agent. (a) Coronal maximum intensity projection (MIP) images and (b and c) 3D reconstructed angiogram of rabbits after injection with Gd@BSA NPs. (d) 3D reconstructed angiogram of rabbits after injection with Gd-DTPA NPs. (e) Angiographic images of iliac arteries and branches of rabbits after injection with Gd@BSA NPs. (f and g) Angiographic images of the secondary and tertiary vessels (red circles) in rabbit hearts after intravenous injection of Gd@BSA NPs and Gd-DTPA. (h and i) Quantitative analysis of the abovementioned vessels. ****P<0.0001.
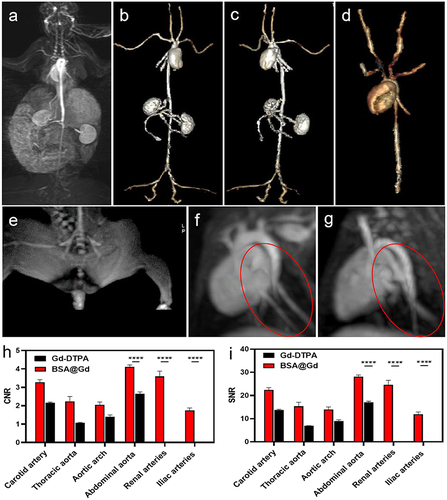
Figure 3 In vivo postcontrast MR images of the Gd@BSA NPs over time. (a) Coronal T1-weighted MR images acquired from rabbits injected with Gd@BSA NPs at a Gd dose of 0.02 mmol/kg body weight. Precontrast and 10 min, 0.5 h, 1 h, 2 h and 24 h postcontrast images are shown from left to right. (b) Dynamic multiphase enhanced MR images of the kidneys from rabbits administered Gd@BSA NPs. (c) T1-weighted MR images of the livers from rabbits injected with Gd@BSA NPs.
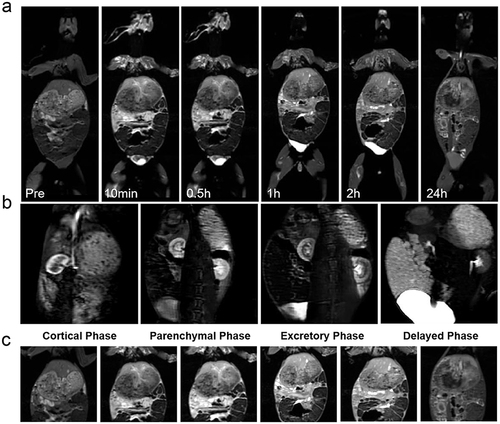
Figure 4 In vivo pharmacokinetics and biodistribution of the Gd@BSA NPs. (a) The mass of Gd detected in feces and urine at different time points after intravenous injection of Gd@BSA NPs (0.1 mmol/kg). (b) Concentration-time profiles of Gd in blood after rabbits were intravenously injected with Gd@BSA NPs. (c) Biodistribution of the Gd@BSA NPs in the major organs of the rabbits 14 days after intravenous injection. Each column represents the mean±SD. ***P<0.001, ****P<0.0001.
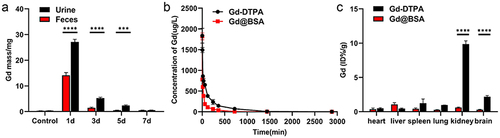
Table 1 Hematology Data from Rabbits Injected with Gd@BSA NPs (n = 3)
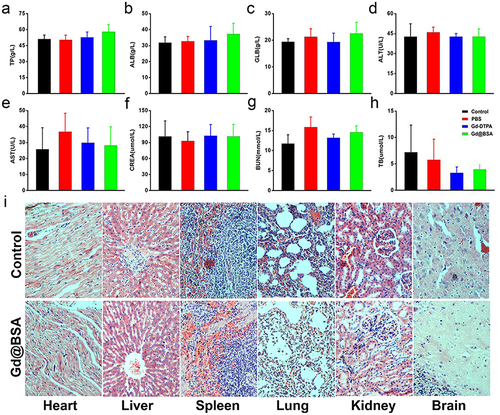
Figure 5 In vivo biosafety of Gd@BSA NPs. (a–h) Blood biochemical indicators from the rabbits preinjection and at 1 day or 14 days postinjection of Gd-DTPA or Gd@BSA NPs. (i) HE-stained images of the major organs from untreated rabbits (control) and rabbits injected with Gd@BSA NPs after 14 days.