Figures & data
Figure 1 The obese placenta is associated with premature senescence. (A) SA-β-Gal staining of E13.5 and E18.5 mouse placental sections from the HFD group and CHD group. Scale bar: 50 μm. (B) Western blot analysis of protein expression of GLB1, P53, and P21 in E18.5 mouse placentas from different groups (n = 6 biologically independent animals from each group). (C) H&E staining of E13.5 and E18.5 mouse placentas sections collected from the HFD group and CHD group. JZ, junctional zone; LZ, labyrinth zone. Scale bar: 1000um. (D) Western blot analysis of protein expression of GLB1, P53, P21, CDK2 and cyclinA2 in human-term placentas (n=6 in the obese group and normal group). (E) SA-β-gal staining of human term placenta. Scale bar: 400 μm. (F). Correlations between the percentage of SA-β-Gal positive cells of human term placenta for each individual and their BMI, with each dot representing one person. P< 0.05 indicates a significant correlation using a two-sided Spearman correlation analysis. (A–E) All data are presented as the mean ± SEM. *p < 0.05, ***p < 0.001. Student’s t-test; F. Two-sided Spearman correlation analysis. All experiments were performed in triplicate.
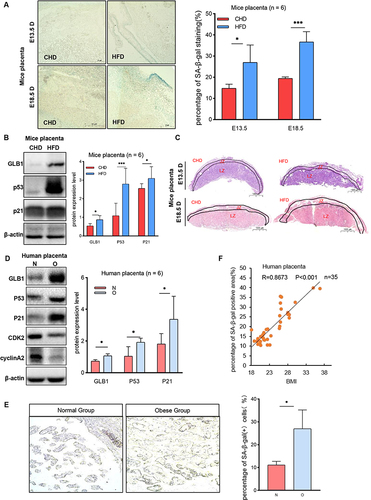
Figure 2 The obese placenta is associated with DNA oxidative damage. (A and B) Immunochemistry analysis of γ-H2AX and 8-OHdG level in paired human term placentas. (n=3 per group, 3 fields per patient); CK7, cytokeratin 7; Scale bar: 200um. (C) Immunofluorescent (IF) detection of 8-OHdG expression in E13.5 and E18.5 mouse placentas collected from the HFD and CHD group. IF staining with an antibody against 8-OHdG is shown in Green, CK7 staining in red, and DAPI staining in blue. n=3 each group, Scale bar:1000um. All data are presented as the mean ± SEM. *p < 0.05. Student’s t-test. All experiments were performed in triplicate.
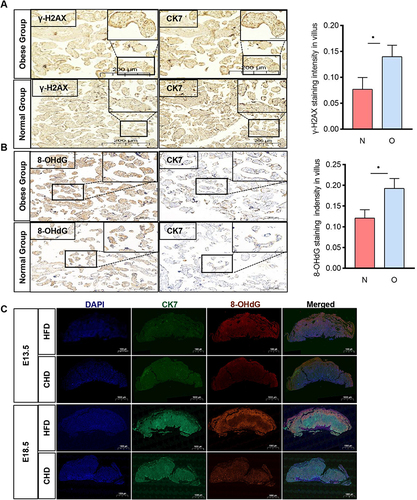
Figure 3 NOX4 expression in placenta of obese pregnancy is elevated. (A) Western blot analysis of protein expression of NOX1-5 in human-term placentas (n=6 in each group). (B) Western blot analysis of protein expression of NOX4 in E18.5 and E13.5 mouse placenta harvested from HFD group and CHD group (n=6 in each group). (C) RT-PCR to analysis mRNA relative expression of NOX1-5 in human placenta tissue (n=8 in the obese group and normal group). (D) RT-PCR to analysis mRNA relative expression of NOX4 in E13.5 and E18.5 mouse placenta (n=8 in the HFD group and CHD group). All data are presented as the mean ± SEM. *p < 0.05, **p < 0.01. Student’s t-test. All experiments were performed in triplicate.
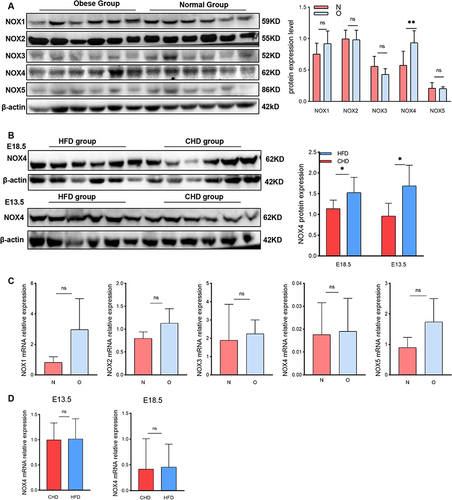
Figure 4 Adipocytes secrete exosomal NOX4. (A) Oil red O staining of primary adipocyte, scale bar: 400μm and 100μm. Western blot (WB) analysis of protein expression of NOX4 in adipocyte. N-AC, normal adipose; O-AC, obese adipocyte; palmitate: toxic fatty acid. (B) Transmission electron microscopy image of adipocyte exosomes (scale bar, 100 nm). Exosome (Exo)-specific markers CD63 and CD81 were measured by WB. Particle size and concentration were analyzed by nanoparticle tracking analysis. (C) Expression of NOX4 in adipocyte-derived exosomes, culture medium and exosome-free supernatant was analyzed by WB. (D) Adipocyte derived exosomes were labeled with PKH67, then added to HTR8/SVneo culture medium. Scale bar: 10μm. (E) Expression of NOX4 in HTR8/SVneo was measured by WB after cocultured with adipocyte-derived exosome. N-Exo, normal adipocyte exosome; O-Exo, obese adipocyte exosome. (F) The effect of EV-secreted inhibitor GW4869 on exosome-dependent NOX4 delivery from adipocyte into HTR8/SVneo. All data are presented as the mean ± SEM. **p < 0.01. Student’s t-test. All experiments were performed in triplicate. (n=3 each group).
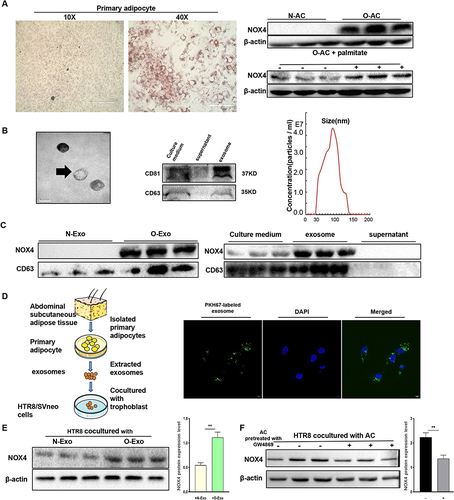
Figure 5 Obese adipocyte-derived exosomes induce senescence in HTR8/SVneo cells. (A) Western blot analysis of protein expression of senescence associated markers in HTR8/SVneo cells after treated with exosomes. (B and C) SA-β-gal staining of HTR8/SVneo cells after cocultured with adipocytes (A) and adipocyte-derived exosomes (B). N-AC, normal adipocyte; O-AC, obese adipocyte; N-Exo, normal adipocyte-derived exosomes; O-Exo, obese adipocyte-derived exosomes. Scale bar: 100 μm. (D and E) HTR8/SVneo cells were treated with exosomes for 24hours, then cells were harvested to analyze the cell cycle distribution by flow cytometry (D) Protein levels of CDK2 and CyclinA2 were measured by WB (E). (F) EdU staining to analyze proliferation of HTR8/SVneo cells after treated with PBS, N-Exo, O-Exo, O-Exo+GKT. GKT, GKT137831, NOX4 inhibitor. Scale bar: 100μm. (G) Wound healing assay. Scale bar: 1000μm. All data are presented as the mean ± SEM. *p < 0.05, **p < 0.01, ***p < 0.001. Student’s t-test. (n=3 each group). All experiments were performed in triplicate.
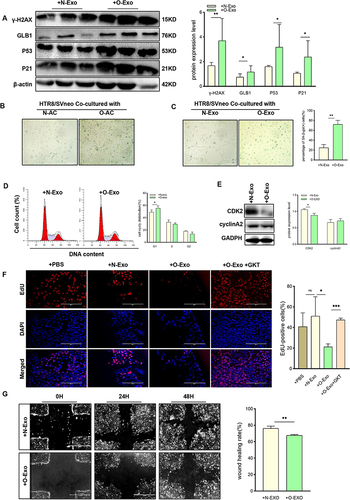
Figure 6 NOX4 was the key component of O-AC derived exosomes to induce senescence in trophoblast. (A–C) HTR8/SVneo were cocultured with O-Exo, O-Exo+GKT (GKT, GKT137831, inhibitor of NOX4), then senescence associated markers were analyzed by Western blot (A); cell cycle distribution was analyzed by Flow cytometry (B); expression of CDK2, cylinA2 was analyzed by Western blot (C). (n=3 each group). (D) Western blot revealed the expression level of NOX4 in adipocytes with NOX4. Overexpression and adipocytes with NOX4 knockdown. (E) Western blot revealed the expression level of NOX4 in exosomes derived from adipocyte with NOX4 overexpression and with NOX4 knockdown; (F) Western blot analyses the protein level of GLB1 and P53 in NOX4 overexpression-, NOX4 knockdown- or mature adipocyte-derived exosome-treated HTR8/SVneo cells. (G). Wound healing assay of HTR8/SVneo cells after treated with NC-Exo, and NOX4OE-Exo. (n=3 each group). (H). Wound healing assay of HTR8/SVneo cells after treated with NC-Exo, and NOX4KD-Exo. (n=3 each group). All data are presented as the mean ± SEM. *P<0.05, **P< 0.01, ***P < 0.001. Student’s t-test. All experiments were performed in triplicate.
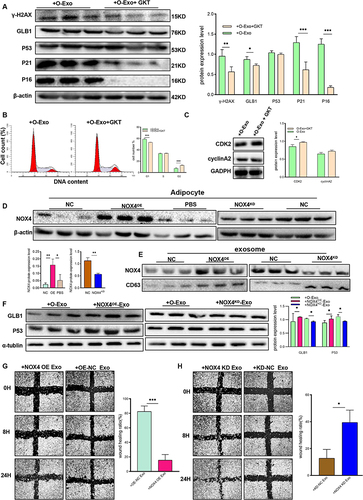
Figure 7 Exosomal NOX4 derived from obese adipocytes induces oxidative stress in trophoblast cells. (A) Reactive oxygen species (ROS) assay by DCFH-DA in HTR8/SVneo cells after respectively treated with N-Exo and O-Exo. (N-Exo, normal adipocyte derived exosome; O-Exo, obese adipocyte derived exosome). (B) Western blot analysis of protein expression of γ-H2AX, GLB1, P53, and P16 in HTR8/SVneo cells after respectively treated with N-Exo, O-Exo, O-Exo+H2O2, O-Exo+NAC. (H2O2, Hydrogen peroxide; NAC, N-acetylcysteine). (C) SA-β-Gal staining of HTR8/SVneo cells after respectively treated with PBS, N-Exo, O-Exo, O-Exo+H2O2, O-Exo+NAC. Scale bar:100μm. (D) ROS production in PBS, GKT, O-Exo, O-Exo+GKT treated HTR8/SVneo cells. (GKT, GKT137831, NOX4 inhibitor). (E) ROS production in control, NOX4 overexpression- or NOX4 knockdown- adipocyte derived exosome-treated HTR8/SVneo cells. (F) IF detection of 8-OHdG expression in HTR8/SVneo cells after respectively treated with PBS, GKT, O-Exo, O-Exo +GKT. IF staining with an antibody against 8-OHdG is shown in Green, CK7 staining in red, and DAPI staining in blue. Scale bar:100μm. N=3 in each group. All data are presented as the mean ± SEM. *P<0.05, **P< 0.01, ***P < 0.001. Student’s t-test. All experiments were performed in triplicate.
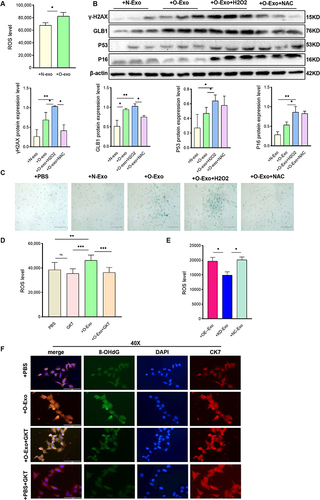
Figure 8 Adipocyte-derived exosome can be delivered to placenta in vivo. (A) Primary mouse adipocytes and induced differentiation for 10 days were stained with oil red O, scale bar: 400µm and 100µm. (B) Identification of mouse adipocyte-derived exosomes. Electron microscope, scale bar: 200nm. Western blot was used to detect CD63 and CD81. (C). Detection of NOX4 protein expression in exosomes, n=3 in each group. (D). Confocal microscopy showing green (PKH67), red (CK7), blue (DAPI) fluorescence and merged images of mouse placenta, after injected PKH67–labeled exosome or its supernatant for 24h, scale bar: 1000µm. Data are presented as mean ± SEM. Student’s t-test. All experiments were performed in triplicate.
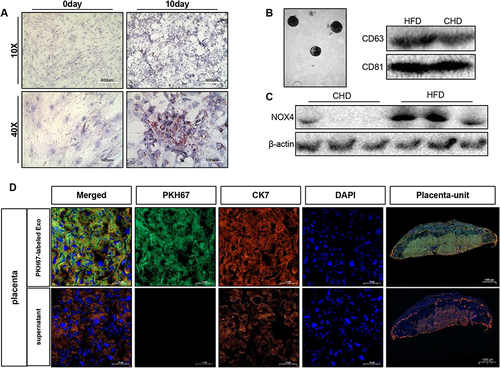
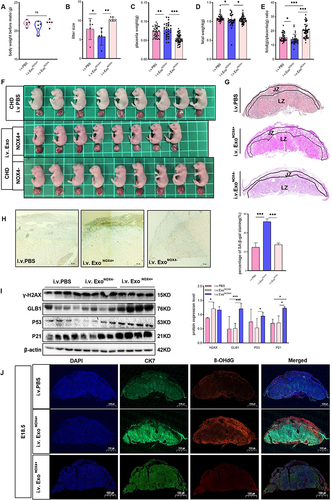
Figure 9 Adipocyte-derived NOX4-containing exosomes can induce premature senescence and maldevelopment in normal mice placenta. (A–J) Mouse were respectively injected with PBS, NOX4-Knockdown (NOX4-) Exo and NOX4-containing (NOX4+) Exo. (A) Weight of mouse before mating. (B) Litter size. (C) Weight of placenta. (D) Weight of fetus. (E) Placenta efficiency (fetal weight/placenta weight). (F) Size of fetus. (G) HE staining of mouse placenta. Scale bar: 1000µm. (H) SA-β-Gal staining in mouse placental tissue (E18.5) (n=5 per group), scale bar: 50µm. (I) Western blot was used to detect the expression of senescence-related markers in mouse placenta (n=4 each group). (J) Immunofluorescence detection of 8-OHdG expression in mouse placental tissue, blue (DAPI), green (CK7), red (8-OHdG), scale: 1000µm. Data of (A–F) are presented as mean ± SD and data of G-J were presented as mean ± SEM. *P<0.05, **P< 0.01, ***P < 0.001. Student’s t-test. All experiments were performed in triplicate.