Figures & data
Figure 1 Photograph of graphene oxide (left) and bacterially reduced graphene oxide (right) at aconcentration of 500 μg/mL.
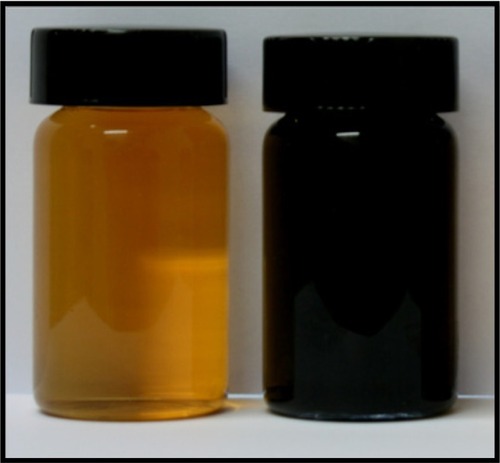
Figure 2 Ultraviolet–visible absorption spectra of graphene oxide (GO) and the reduced grapheneoxide (rGO) suspension reduced by bacterial biomass (50 μg/mL).
Abbreviation: Abs, absorption spectrum.
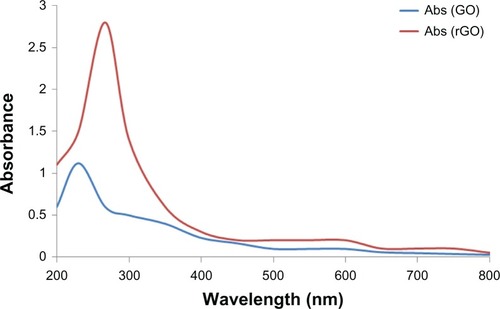
Figure 3 X-ray diffraction patterns of (A) graphene oxide and (B) bacteriallyreduced graphene oxide.
Note: The arrow indicates the position of crystalline peak of reduced grapheneoxide. The dot represent the intensity value of peak.
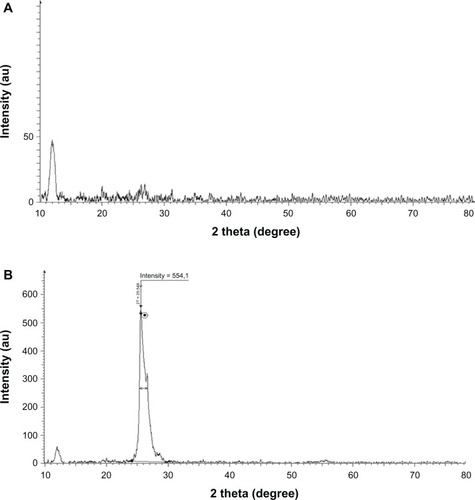
Figure 4 Hydrodynamic size distribution of (A) graphene oxide and (B)bacterially reduced graphene oxide (500 μg/mL) measured by dynamic light scattering at roomtemperature in deionized water.
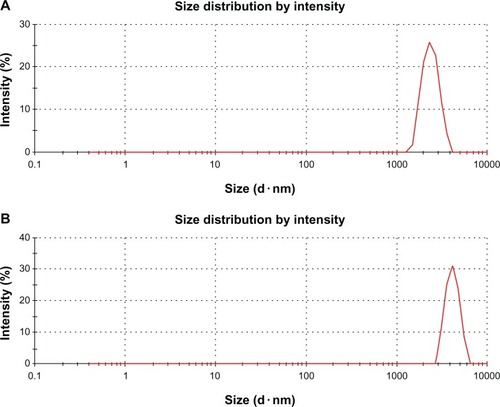
Figure 5 Scanning electron microscopy images of (A) graphene oxide and (B)bacterially reduced graphene oxide.
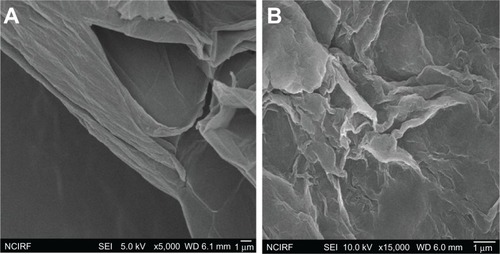
Figure 6 Raman spectra of (A) graphene oxide and (B) bacterially reducedgraphene oxide.
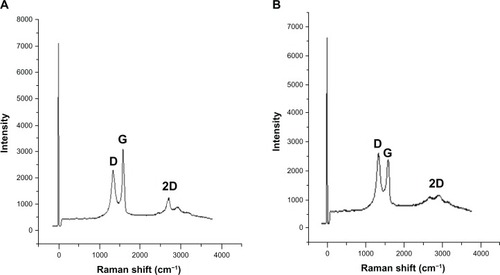
Figure 7 Atomic force microscopy images of (A) graphene oxide and (B)bacterially reduced graphene oxide.
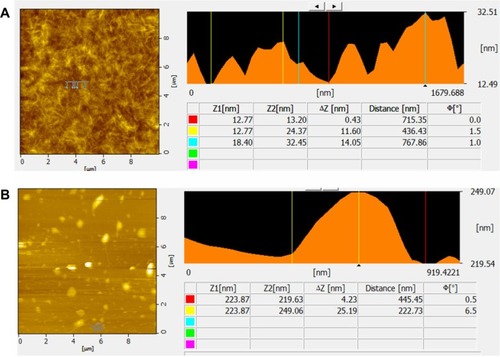
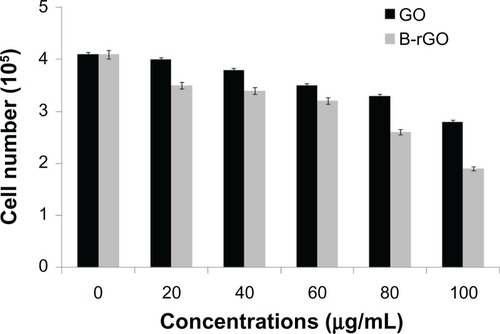
Figure 8 The effect of graphene oxide (GO) and bacterially reduced graphene oxide (B-rGO) on cellviability of MCF-7 cells.
Notes: The cell viability of MCF-7 cells was determined by WST-8 assay after 24hours of exposure to different concentrations of GO or B-rGO. The results represent the means ofthree separate experiments and error bars represent the standard error of the mean. Treated groupsshowed statistically significant differences from the control group, as determined usingStudent’s t-test (P < 0.05).
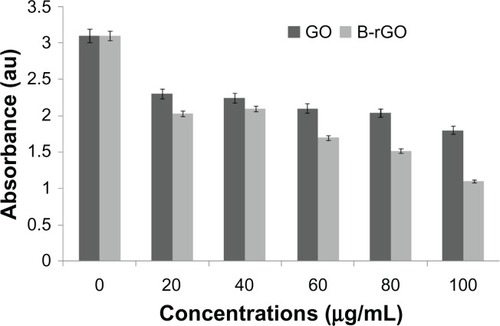
Figure 9 Generation of reactive oxygen species (ROS) in graphene oxide (GO)-and bacterially reducedgraphene oxide (B-rGO)-treated MCF-7 cells.
Notes: The relative fluorescence of 2′,7′-dichlorofluorescein wasmeasured using a spectrofluorometer with excitation at 485 nm and emission at 530 nm. The resultsrepresent the means of three separate experiments and the error bars represent the standard error ofthe mean. Treated groups showed statistically significant differences from the control group, asdetermined by Student’s t-test (P < 0.05).
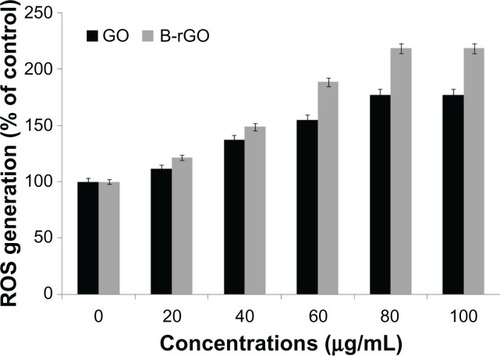
Figure 10 The effect of graphene oxide (GO) and bacterially reduced graphene oxide (B-rGO) on lactatedehydrogenase (LDH) activity in MCF-7 cells.
Notes: LDH activity was measured by changes in optical densities due to nicotinamideadenine dinucleotide reduction, monitored at 490 nm, as described in “Materials andmethods,” using a cytotoxicity detection lactate dehydrogenase kit. The results representthe means of three separate experiments and the error bars represent the standard error of the mean.Treated groups showed statistically significant differences from the control group, as determined byStudent’s t-test (P < 0.05).
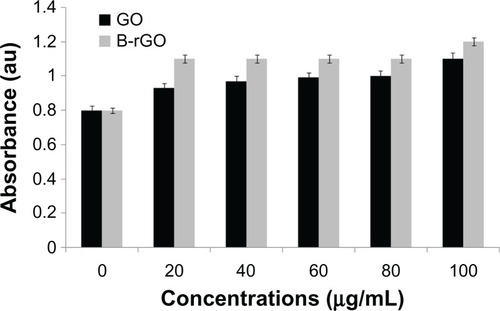
Figure 11 The effect of graphene oxide (GO) and bacterially reduced graphene oxide (B-rGO) on the mortalityof MCF-7 cells.
Notes: The mortality of MCF-7 cells was determined using trypan blue assay after 24hours of exposure to different concentrations of GO or B-rGO. The results represent the means ofthree separate experiments and the error bars represent the standard error of the mean. Treatedgroups showed statistically significant differences from the control group, as determined byStudent’s t-test (P < 0.05).