Figures & data
Table 1 List of Specific Primers
Figure 1 Identification of DPSCs, PDLSCs and DPSC-EXO. (A) Differentiation potential of osteogenesis of DPSCs and PDLSCs was confirmed by Alizarin red staining. (B) Differentiation potential of adipogenesis of DPSCs and PDLSCs was confirmed by Oil red O staining. (C) Identification of surface markers of DPSCs indicated that the harvested DPSCs were positive for CD73 and CD90 and were negative for CD45, CD31 and Nestin. (D) Identification of surface markers of PDLSCs indicated that the harvested PDLSCs were positive for CD29, CD90 and CD105 and negative for CD45 and CD31. (E) The typical saucer-like morphology of DPSC-EXO was captured by transmission electron microscopy. (F) DPSC-EXO was positive for the exosomal surface markers CD9 and CD63 by Western Blot. (G) Particle size of DPSC-EXO was analyzed by NTA.
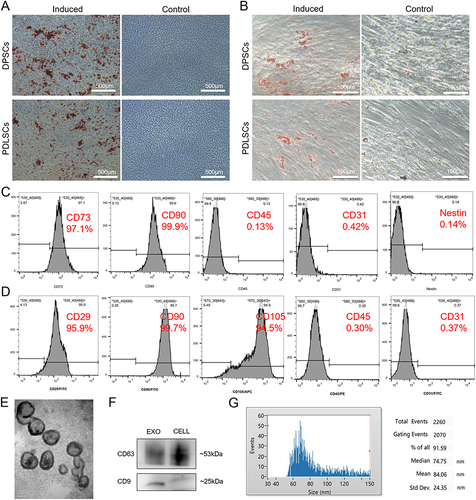
Figure 2 The uptake of exosomes by PDLSCs and RAW264.7 cells and the effects of different concentrations (0, 1, 5, 10 µg/mL) of DPSC-EXO on the proliferation and migration of PDLSCs. (A) DPSC-EXO were endocytosed by PDLSCs and RAW264.7 cells. (B) The wound healing assay showed that DPSC-EXO promoted the migration of PDLSCs in a concentration-dependent manner. (C) Quantitative analysis of the wound healing assay. (D) CCK8 assay showed that DPSC-EXO promoted cell proliferation. (*p<0.05, **p<0.01, ***p<0.001, n=3).
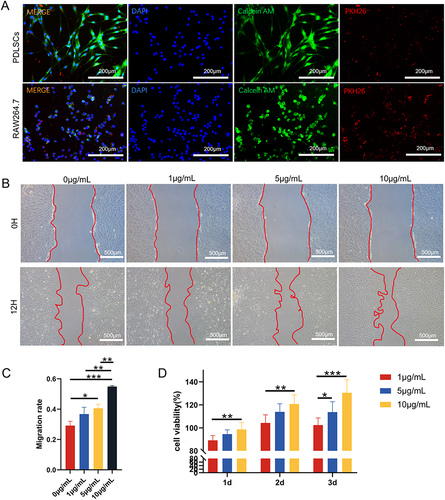
Figure 3 The effect of DPSC-EXO on the osteogenesis of PDLSCs. (A) qRT‒PCR showed that the expression of Col1a1, DSPP, OCN, and OPN was significantly increased with increasing exosome concentration. (B) ALP staining showed that the expression of alkaline phosphatase increased significantly with increasing exosome concentration. (C) ALP quantitative analysis. (D) Alizarin red staining showed that calcium deposition increased significantly with increasing exosome concentration. (*p<0.05, **p<0.01, ***p<0.001, n=3).
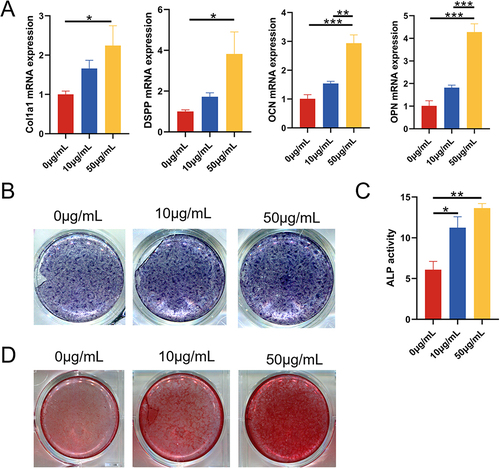
Figure 4 The effect of DPSC-EXO on the inflammation of PDLSCs induced by LPS. (A) qRT‒PCR showed that under exosome coculture conditions, the gene expression of IL-6 and TNF-α was significantly downregulated, while the gene expression of IL-10 and TGF-β was significantly upregulated in a concentration-dependent manner. (B) Western blot analysis showed that the expression of IL-1β and TNF-α was obviously downregulated by DPSC-EXO treatment. (C) Quantitative analysis of protein expression showed that the expression levels of IL-1β and TNF-α were obviously downregulated by DPSC-EXO treatment. (*p<0.05, **p<0.01, ***p<0.001, ****p<0.0001, n=3).
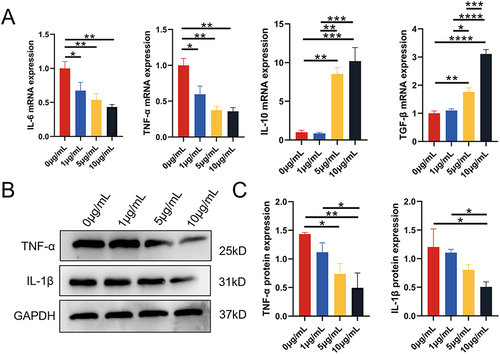
Figure 5 The effect of DPSC-EXO on the polarization phenotype of macrophages. (A) Flow cytometry showed that compared with the control group (59.0%), the number of F4/80+CD86+ cells (46.7%) in the EXO group decreased significantly. (B) Quantitative analysis of F4/80+CD86+ cells (C) In the EXO group, F4/80+CD206+ cells (24.6%) were significantly higher than those in the control group (0.76%). (D) Quantitative analysis of F4/80+CD206+ cells (E) qRT‒PCR showed that the mRNA expression of CD86 and IL-1β, polarizing markers of M1 macrophages, decreased with DPSC-EXO treatment. (F) The mRNA expression of Arg1 and IL-10, polarizing markers of M2 macrophages, were significantly increased with DPSC-EXO treatment. (*p<0.05, **p<0.01, ***p<0.001, ****p<0.0001, n=3).
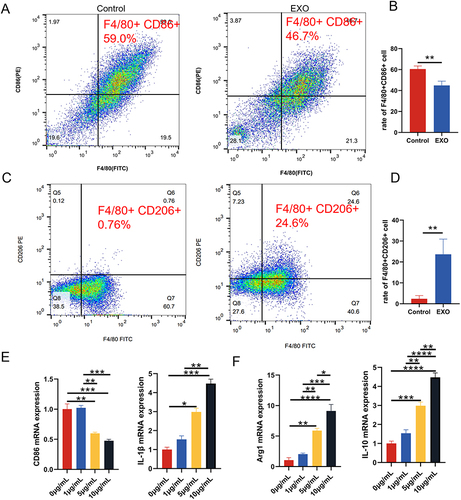
Figure 6 Inhibition of the IL-6/JAK2/STAT3 signaling pathway by DPSC-EXO. (A) Protein expression levels of IL-6, JAK2, p-JAK2, STAT3 and p-STAT3. (B-E) Quantitative analysis of protein expression in (A). (F) The protein expression levels of IL-1β and TNF-α were downregulated after using a JAK2 inhibitor (TG101348) to treat PDLSCs stimulated by LPS. (G) Quantitative analysis of protein expression in (F). (*p<0.05, **p<0.01, ***p<0.001, n=3).
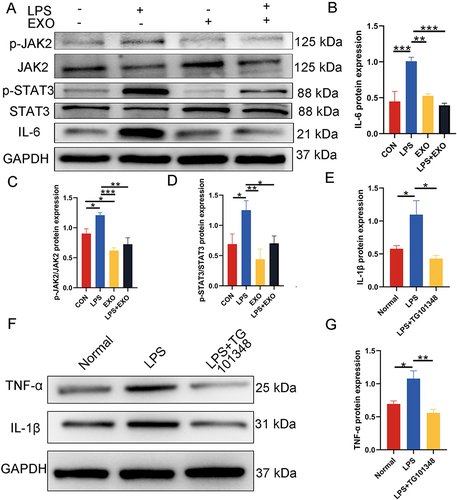
Figure 7 The therapeutic effect of DPSC-EXO on periodontitis in rats. (A) Representative sagittal 3D and 2D views of the maxillary molars from micro-CT scanning. The red line corresponds to the distances of ABC-CEJ. (B) and (C) Measurement of the BV/TV and the distance from the ABC to the CEJ in each group. (D) Representative H&E-stained sections of periodontal tissues harvested from each group at low and high magnifications. The green box shows the details of gingiva, and the yellow box shows the details of alveolar bone crest. (E) The degree of osteoclast infiltration in representative TRAP-stained sections of periodontal tissues. (F) Quantitative analysis of osteoclast number between the first and second molars. The yellow arrows show that osteoclasts are stained red. (B) Buccal side; (P) Palatal side; PD: Periodontitis; BV/TV: Bone tissue volume/tissue volume (%); ABC-CEJ: Alveolar bone crest and the cementoenamel junction; Results are the mean ± s.d. (*p < 0.05, **p < 0.01, ***p<0.001, ****p<0.0001, n = 4).
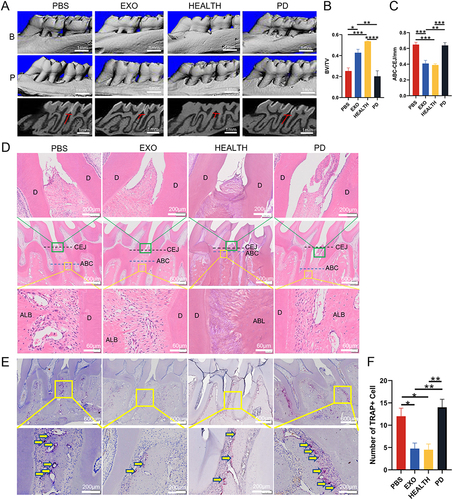
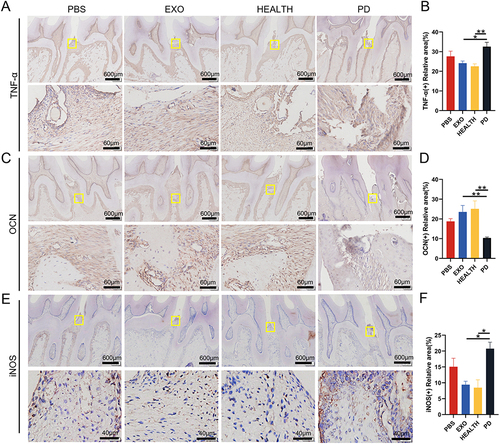
Figure 8 Immunohistochemical staining of periodontal tissue. (A and B) Inflammatory marker TNF-α staining and semi quantitative analysis. (C and D) Osteogenic marker OCN staining and semi quantitative analysis. (E and F) M1 macrophage marker iNOS staining and semi quantitative analysis. Results are the mean ± s.d. (*p < 0.05, **p < 0.01, n = 3).