Figures & data
Figure 1 Characterization of Qu-exosome-SPIONs. (A) TEM image of Qu-exosome-SPIONs. The red arrows indicate the SPIONs distributed on the surface of the exosomes. (B) Particle size distribution of Qu-exosome-SPIONs. (C) Change in size of Qu-exosome-SPIONs stored in serum at 37 °C. (D) Change in quercetin concentration in Qu-exosome-SPIONs stored in serum at 37 °C. (E) Solubility analysis of quercetin by HPLC. n=3, bars with the same letter do not differ significantly (p >0.05).
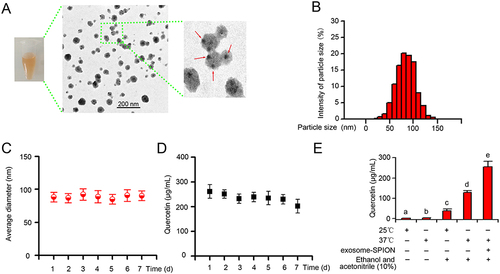
Figure 2 Targeting capacity of Qu-exosome-SPIONs in vitro. Quercetin was labeled with cy5.5 and the cells were washed before fluorescence microscopy observation. n=3.
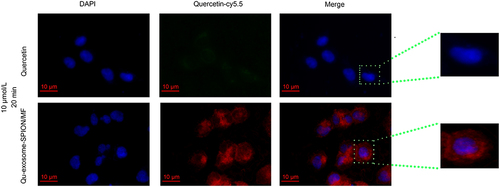
Figure 3 Insulin secretagogue and antiapoptotic activities of Qu-exosome-SPIONs/MF in MIN-6 cells. (A) Insulin secretagogue effects of Quercetin, Qu-exosome-SPIONs, and Qu-exosome-SPIONs/MF (0–40 μmol/L) in the absence and presence of 8.3 mmol/L GLC. Data are expressed relative to the response obtained in the absence of quercetin, Qu-exosome-SPION, or Qu-exosome-SPIONs/MF (0 μmol/L) with 8.3 mmol/L GLC, taken as 100%. (B) Effects of increasing concentrations of H2O2 (0, 10, 25, 50 and 100 μmol/L) on MIN-6 cell viability and insulin secretion in the presence of 8.3 mmol/L GLC. (C) Effect of quercetin, Qu-exosome-SPIONs, and Qu-exosome-SPIONs/MF (20 μmol/L) on MIN-6 cell viability and insulin secretion in the presence of 8.3 mmol/L GLC. 50 μmol/L H2O2 was added at the beginning of the incubation period for 1 h. Data are expressed relative to the response obtained in 0 μmol/L H2O2 in the presence of 8.3 mmol/L GLC, taken as 100%. (D) Anti-apoptosis effects of quercetin, Qu-exosome-SPIONs, and Qu-exosome-SPIONs/MF on MIN-6 cells. Nuclei were stained with DAPI (blue), and apoptotic MIN6 cells were stained with TUNEL (green). (E) Proportion of TUNEL-positive cells. n=3, significance levels are shown as *p < 0.05 and **p < 0.01 vs 0 μmol/L quercetin, Qu-exosome-SPIONs, and Qu-exosome-SPIONs/MF in. (A), or vs 0 μmol/L H2O2 in (B and C).
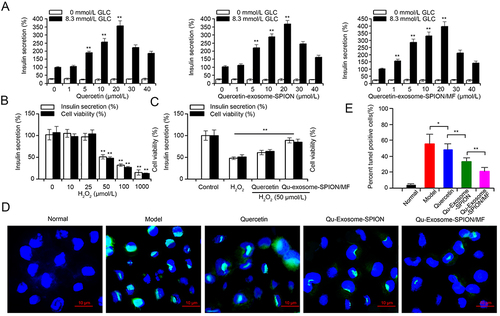
Figure 4 In vivo targeting capacity of Qu-exosome-SPIONs/MF. (A) NIRF imaging and (B) fluorescence intensity of Cy5.5-labeled quercetin and Qu-exosome-SPIONs in the pancreas of Kunming mice 10 or 30 min after venous injection in the absence or presence of an external MF (MF density: 1 T). n=3, **indicates a statistically significant difference at p <0.01 vs the quercetin group.
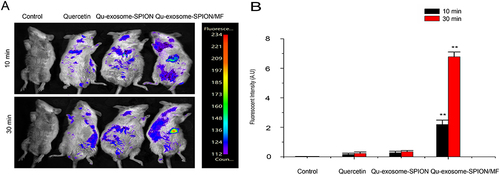
Figure 5 Acute therapeutic effects of Qu-exosome-SPIONs/MF in T2DM model mice. Effects of Qu-exosome-SPIONs/MF (A) on GLC tolerance and (B) the corresponding AUC. Effects of Qu-exosome-SPIONs/MF (C) on insulin secretion and (D) the corresponding AUC. n=6, significance levels are shown as *p < 0.05 and **p < 0.01 vs the model group.
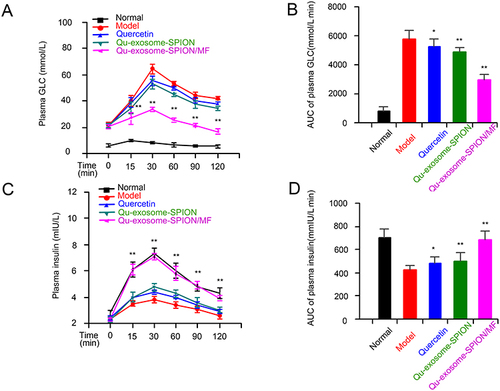
Figure 6 Chronic therapeutic effects of Qu-exosome-SPIONs/MF on T2DM model mice. (A) Effect of Qu-exosome-SPIONs/MF on body weight. (B) Effect of Qu-exosome-SPIONs/MF on food intake. (C) Effect of Qu-exosome-SPIONs/MF on hepatic TG. (D) Effect of Qu-exosome-SPIONs/MF on hepatic glycogen. (E) Effect of Qu-exosome-SPIONs/MF on glycosylated hemoglobin. n=6, **indicates a statistically significant difference at p <0.01 vs model group.
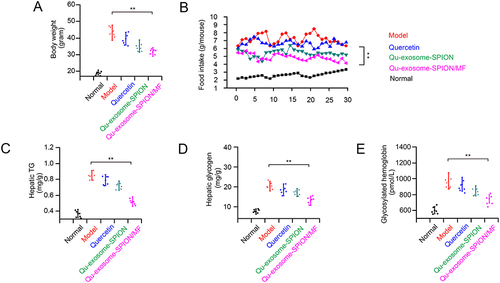
Table 1 Effect of Qu-Exosome-SPIONs/MF on AST and ALT
Table 2 Effect of Qu-Exosome-SPIONs/MF on HOMA-IR and HOMA-β
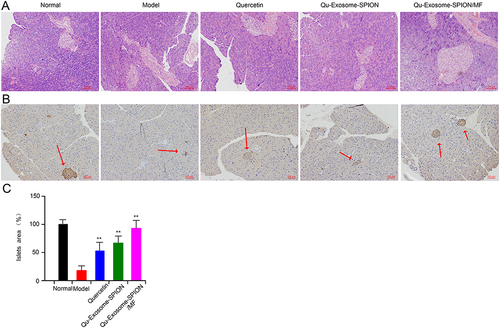
Figure 7 Effect of Qu-exosome-SPIONs/MF on pancreatic islet morphological changes. (A) Histological changes in pancreatic islets and livers. (B) Anti-insulin immunostaining of the pancreas. The red arrows indicate the insulin positive pancreas islet. (C) Islet areas (%) in pancreatic sections. Data are expressed relative to the response obtained in the normal group, which was taken as 100%, n=20, **indicates a statistically significant difference at p <0.01 vs the model group.
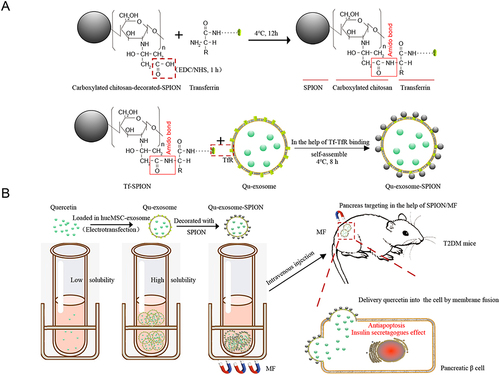
Scheme 1 Schematic illustration for (A) the synthesis of Qu-exosome-SPION and (B) how Qu-exosome-SPION/MF exhibit their antidiabetic activity in vivo.