Figures & data
Figure 1 Transmission electron microscopy image for silica nanoparticles.
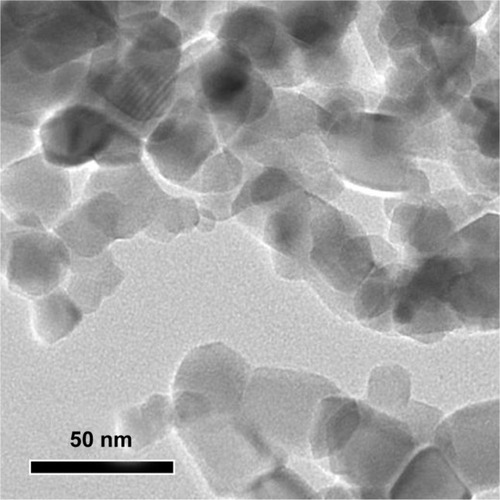
Figure 2 Reactive oxygen species, H2O2, tumor necrosis factor-α, and nitric oxide produced by SiO2 NP-stimulated Kupffer cells. (A) Intracellular reactive oxygen species (ROS) levels of Kupffer cells (KCs) incubated with different concentrations of silica nanoparticles (SiO2 NPs) for 24 hours; (B) H2O2 levels in the supernatant of KCs; (C) tumor necrosis factor (TNF)-α levels in the supernatant of KCs; and (D) the level of nitric oxide (NO) in the supernatant of KCs after treatment with SiO2 NPs for 24 hours.
Notes: Untreated KCs served as the negative control. Data represent mean ± SD, n = 3. *P < 0.05 when compared with control; **P < 0.01 when compared with control.
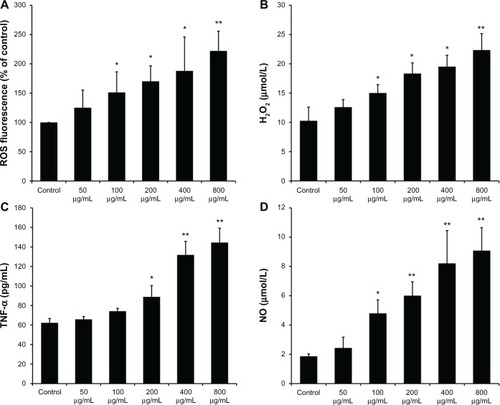
Figure 3 Kupffer cell-mediated cytotoxicity in Buffalo rat liver (BRL) cells. (A) The viability of BRL cells was measured by CCK-8 assay after coculture with the supernatants of silica nanaoparticles (SiO2 NPs) stimulated Kupffer cells (KCs) for 24 hours; (B) lactate dehydrogenase (LDH) levels in the medium of BRL cells after coculture with the supernatants of SiO2 NP-stimulated KCs for 24 hours; and (C) aspartate aminotransferase (AST) levels in the medium of BRL cells after coculture with the supernatants of SiO2 NP-stimulated KCs for 24 hours.
Notes: Data represent mean ± SD, n = 3. *P < 0.05 when compared with control; **P < 0.01 when compared with control.
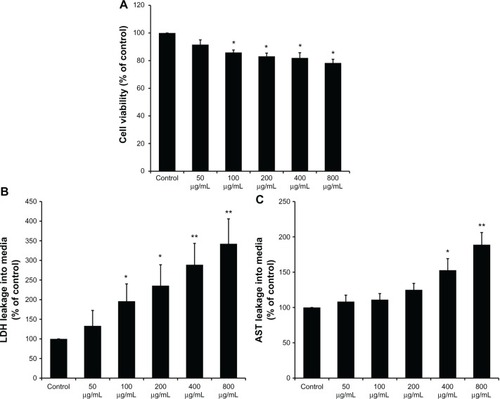
Figure 4 Morphological characterization of Buffalo rat liver (BRL) cells. BRL cells were treated with the supernatant of Kupffer cells stimulated by different concentrations of silica nanoparticles (SiO2 NPs). At the end of the 24-hour exposure, BRL cells were washed with phosphate-buffered solution and the cells were visualized by inverted microscopy (200× magnification). (A) Control; (B) 50 μg/mL; (C) 100 μg/mL; (D) 200 μg/mL; (E) 400 μg/mL; and (F) 800 μg/mL of SiO2 NPs.
Note: Arrows indicate cells with nuclear condensation and irregular shapes.
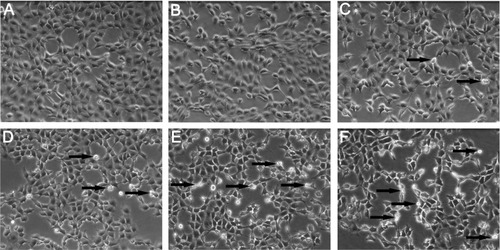
Figure 5 Histological analyses and immunohistochemical stain of rat livers following an intravenous injection of silica nanoparticles (50 mg/kg body weight) at 48 hours. (A-C) Hematoxylin-eosin stain of liver sections (200× magnification) taken from (A) control and (B) silica nanoparticle (SiO2 NP)-treated group. The boxed area is magnified 500× and shown in (C). The liver of the SiO2 NP group showed inflammatory cell infiltrate (arrow). (D–F) Immunohistochemical stain for CD68 in liver sections (200× magnification) taken from (D) control and (E) SiO2 NP group. The boxed area is magnified 500× and shown in (F). The liver of the SiO2 NPs group showed strong positive signals for CD68 (arrow). (G) The mean number of Kupffer cells in the sections of livers per high-power field.
Notes: Data represent mean ± SD, n = 6. *P < 0.05 when compared with control.
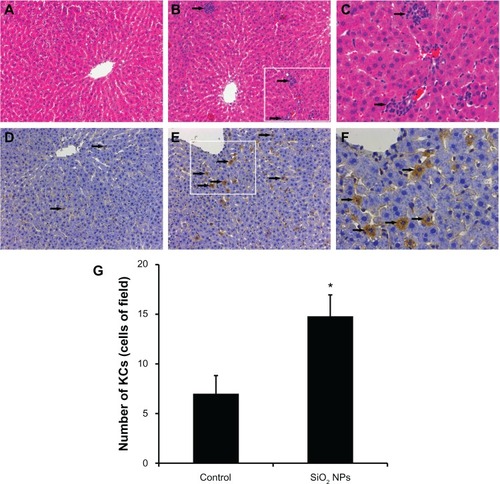
Figure 6 Changes in H2O2, GSH, SOD, and MDA levels of rat livers following an intravenous injection of SiO2 NPs (50 mg/kg body weight) at 48h. Levels of (A) H2O2; (B) GSH (C) SOD; and (D) MDA.
Notes: Data represent mean ± SD, n = 6. *P < 0.05 when compared with control.
Abbreviations: H2O2, hydrogen peroxide; GSH, glutathione; SOD, superoxide dismutase; MDA, malondialdehyde; prot, protein.
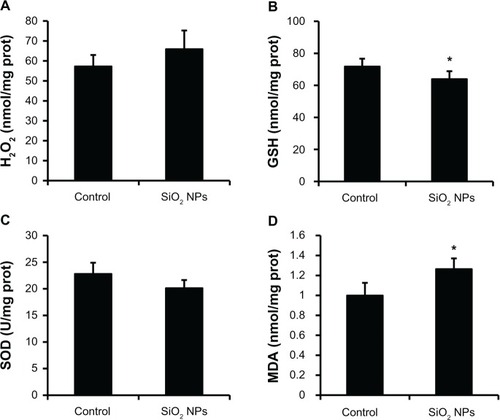
Table 1 Effect of SiO2 NPs on selected clinical chemistry parameters
Table 2 Effect of SiO2 NPs on selected clinical hematology parameters
Table 3 Summary of variations of liver metabolites
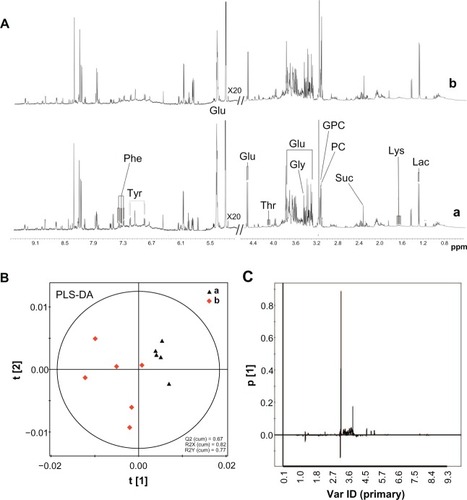
Figure 7 1H NMR spectra and PLS-DA of liver tissue extracts from rats following an intravenous injection of silica nanoparticles (50 mg/kg body weight) at 48 hours. (A) 1H NMR spectra; (B) PLS-DA score plots derived from 1H NMR spectra; and (C) coefficient plots derived from 1H NMR spectra.
Notes: (a) Control and (b) silica nanoparticle (SiO2 NP)-treated group.
Abbreviations: Glu, glucose; Gly, glycine; GPC, sn-glycero-3-phosphocholine; Lac, lactate; Lys, lysine; NMR, nuclear magnetic resonance; PC, phosphorylcholine; Phe, phenylalanine; ppm, parts per million; Suc, succinate; Thr, threonine; Tyr, tyrosine; Var ID, variable ID.