Figures & data
Figure 1 Schematic workflow for the optimization of DNA-loaded LNPs for the expression of CAR-CD19BBz. (A) Schematic representation of the components used for LNP synthesis by microfluidic. (B) Representation of the mini-library of LNPs (left) and DLS measurement of the optimized LNP-9-CAR. (C) Schematic representation of LNP screening using Jurkat cells. (D) Representation of the transfection of T cells using the optimized LNP for the expression of CAR-CD19BBz and co-culture experiments with Raji cells to assess effector cell activation and tumor cell specific killing.

Table 1 Composition and Characterization of pDNA-ZsGreen Encapsulated in LNPs with Different DOPE and Cholesterol Ratios
Table 2 Composition and Characterization of pDNA-CAR-CD19BBz Encapsulated LNPs with Different DOPE and Cholesterol Ratios
Figure 2 DNA loaded LNPs induce transient expression of CAR-CD19BBz in Jurkat cells. (A) Schematic of LNP-CAR mediated transfection of Jurkat cells. (B) CAR-CD19BBz expression in live (PI−) Jurkat cells 3 days after transfection with LNP-5-CAR with different amounts of pDNA identifying the best concentration to be used. * p<0.05; **** p<0.0001 versus 420 ng/ 60,000 cells evaluated by one-way ANOVA with n=3. (C) Cell viability of Jurkat cells assessed by the frequency of PI− cells after transfection with LNP-5-CAR. (D) CAR-CD19BBz expression over time in Jurkat cells treated with 420 ng/60,000 cells of LNP-5-CAR confirming the transient expression of CAR in these cells. ** p<0.01; ***p<0.001; ****p<0.0001 versus NTC on the same timepoint evaluated by one-way ANOVA with n=3. (E) Cell viability of Jurkat cells over time. * p<0.05; ****p<0.0001; Not significant (ns) p>0.05 versus NTC on the same timepoint evaluated by one-way ANOVA with n=3.
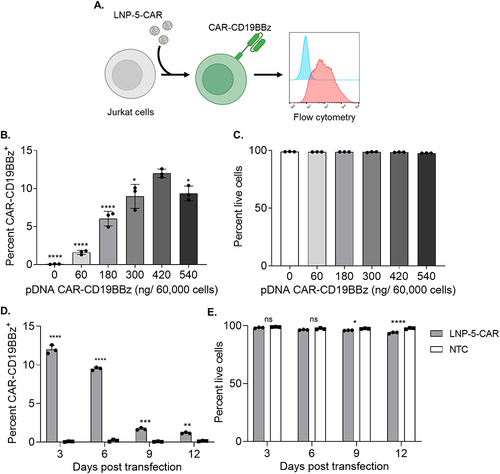
Figure 3 Higher DOPE molar ratios facilitate efficient transfection with CAR-CD19BBz in Jurkat cells. (A) Schematic of the components used to prepare LNPs by microfluidic mixing. (B) Schematic of LNP-CAR screening using Jurkat cells. (C) Hydrodynamic diameter (Size) and polydispersity index (PDI) of different LNPs encapsulating CAR-CD19BBz pDNA. (D) Zeta potential of different LNPs. (E) Representative cryo-TEM of LNPs encapsulating pDNA. (F) CAR-CD19BBz expression in live (PI−) Jurkat cells 3 days after transfection with different LNPs identifying top-performing LNPs. **** p<0.0001 versus NTC evaluated by one-way ANOVA with n=3. (G) Cell viability of Jurkat cells assessed by the frequency of PI− cells after transfection with top-performing LNPs **** p<0.0001 versus NTC; evaluated by one-way ANOVA with n=3. (H) Representative histograms of CAR-CB19BBz expression after transfection. NTC = non-transfected control; EP = Electroporation; Lipo = Lipofectamine. Graphs represent mean ± SD. (I) CAR-CD19BBz expression measured by mean fluorescence intensity (MFI) after transfection with top-performing LNPs and controls. **p<0.01; ****p<0.0001; Not significant (ns) p>0.05 versus NTC evaluated by one-way ANOVA with n=3. “a” = p<0.001 compared to EP; “b” = p<0.001 compared to Lipo evaluated by one-way ANOVA with n=3. NTC = non-transfected control; Graphs represent mean ± SD.
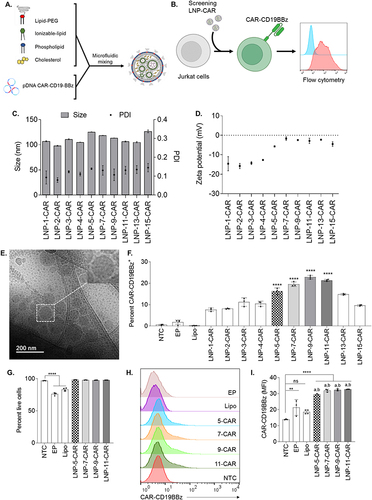
Figure 4 Top-performing LNPs generate CAR-Jurkat cells with high efficiency. Jurkat cells were transfected with top-performing LNPs using 420 ng/60,000 cells, collected after 3 days and co-cultured at 1:1 or 1:0 ratios with Raji cells. (A) Schematic of Jurkat cell transfection with LNP-CAR and effector cell activation after co-culture with Raji cells. (B) Representative histogram of Jurkat and Raji cells distinguished based on the expression of CD19. (C) Expression of activation markers PD-1 and CD69 in Jurkat cells expressing CAR-CD19BBz. (D and E) Activation of Jurkat cells expressing CAR-CD19BBz measured by mean fluorescence intensity (MFI) of CD69 (D) and PD-1 (E) after 24 hours co-cultured with Raji cells. * p<0.05; ** p<0.01; ***p<0.001; **** p<0.0001 Not significant (ns) p>0.05 versus LNP-9-GN1; “a” = p<0.001 compared to 1:1; “b” = p<0.0001 compared to 1:1; evaluated by one-way ANOVA with n=3. (F and G) Activation of Jurkat cells transfected with the optimized formulation LNP-9 24 hours after co-culture with Raji cells at different effector-to-target ratios. Activation was assessed by the expression of CD69 (F) and PD-1 (G). *p<0.05; **p<0.01; ***p<0.001; Not significant (ns) p>0.05 evaluated by two-way ANOVA with n=3. Graphs represent mean ± SD.
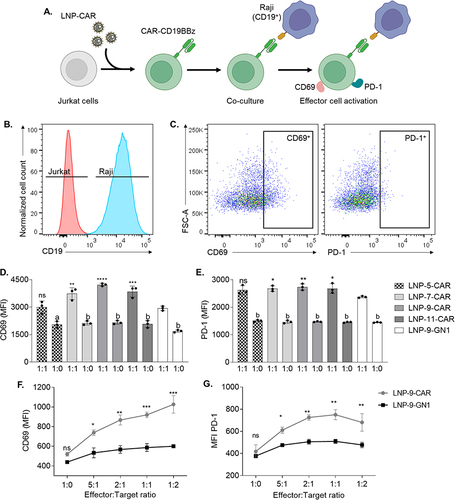
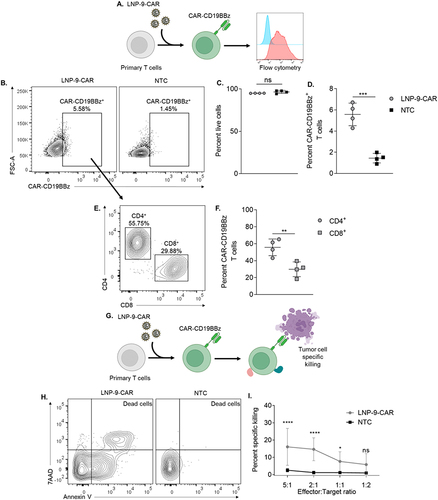
Figure 5 LNP-9-CAR promotes functional delivery of pDNA to primary human T cells. (A) Schematic of primary human T cell transfection with LNP-9-CAR (B) Representative plots of CAR-CD19BBz expression 3 days after transfection of primary human T cells with LNP-9-CAR. (C) Cell viability of CD3+ cells 3 days after transfection with LNP-9-CAR. Not significant (ns) p>0.05 evaluated by unpaired t-test compared to NTC. (D) Frequency of Live/CD3+/CAR-CD19BBz+ T cells analyzed 3 days after transfection with LNP-9-CAR. ***p<0.001 evaluated by unpaired t-test compared to NTC. (E) Representative plots of T cell subsets expressing CAR-CD19BBz 3 days after transfection with LNP-9-CAR identified by the expression of CD4 and CD8. (F) Frequency of Live/CD3+/CAR-CD19BBz+ CD4+ and CD8+ T cells analyzed 3 days after transfection with LNP-9-CAR. **p<0.01 evaluated by unpaired t-test compared to NTC. (G) Schematic of T cell transfection with LNP-9-CAR and tumor cell specific killing in co-culture with Raji cells. (H) Representative plots of Annexin V/7AAD labeled cells gated on the CD3−/CD19+ population. Dead cells are labeled as double positive for both markers. (I) Results of specific killing of CD19+ 24 hours after coplating with CAR T cells or non-transfected cells at different ratios. *p<0.05; ****p<0.0001; Not significant (ns) p>0.05 evaluated by two-way ANOVA with n=4 donors. NTC = non-transfected control. Graphs represent mean ± SD.