Figures & data
Scheme 1 Schematic illustration of BSA@IR-817 for NIR fluorescence image and photothermal therapy of melanoma. By Figdraw.
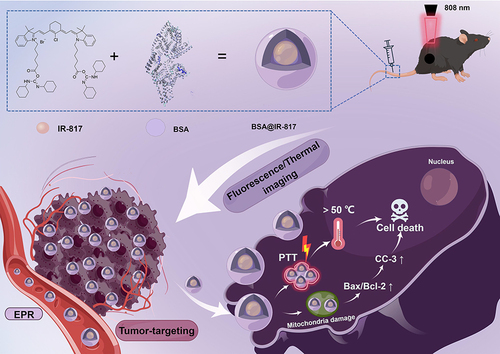
Figure 1 Rational screening process of HSA@IR-817 and BSA@IR-817. Fluorescence emission spectra of different concentrations of (A) BSA@IR-817 and (B) HSA@IR-817 with the molar ratio of albumin/IR-817 as 1:1 in PBS. Fluorescence emission spectra of 10 μM IR-817 mixed with different concentrations of (C) BSA or (D) HSA to achieve different ratios (4:1, 3:1, 2:1, 1:1, 1:2, 1:3, and 1:4). Electrophoresis gel analysis of (E) BSA@IR-817 and (F) HSA@IR-817 in NIR and white light. (G) Infrared absorption spectra of BSA@IR-817 and HSA@IR-817 (10 μM, 1:1). (H) NIR image of 10 μM BSA@IR-817 and IR-817 in an EP tube. (I) Infrared absorption spectra and (J) fluorescence emission spectra of 10 μM BSA@IR-817, BSA@ICG, IR-817 in BSA, IR-817 in PBS, ICG in BSA, and ICG in PBS.
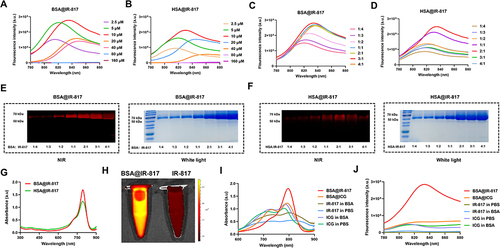
Figure 2 Characterization of BSA@IR-817 nanoparticles. (A) Scanning electron microscopy (SEM) image of BSA@IR-817. Scale bars: 1 μm (left image); 200 nm (right image). (B) Hydrodynamic size distribution of BSA and BSA@IR-817. (C) The hydrodynamic diameter of BSA@IR-817 during 12 days. (D) Zeta potential of BSA@IR-817, BSA, and IR-817. (E) The relative fluorescence intensity of BSA@IR-817 and IR-817 at different concentrations. (F) The relative fluorescence intensity of 10 μM BSA@IR-817, IR-817, and ICG right after the dilution process or 24 h of storage (in light or dark).
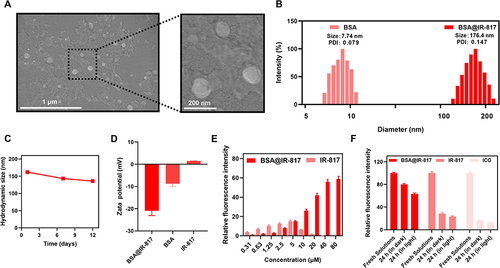
Figure 3 The fluorescence imaging of BSA@IR-817 in vitro and in vivo. (A) The fluorescence images of B16-F10 cells were incubated with 10 μM BSA@IR-817, IR-817, and ICG for different times (0.5, 1, 2, 4, 8, and 16 h). (B) The quantification of relative fluorescence signal intensity in (A) changed over time. (C) Fluorescence imaging of the mice at different time points (0, 2, 6, 12, and 24 h) after intravenous injection of BSA@IR-817, IR-817, and ICG. The white dashed circle indicated the inoculated tumor area in the mice. (D) Fluorescence statistics of BSA@IR-817, IR-817, and ICG in mice. Values represent the mean ± SD, * p <0.05, *** p <0.001, **** p <0.0001, compared with the other two groups.
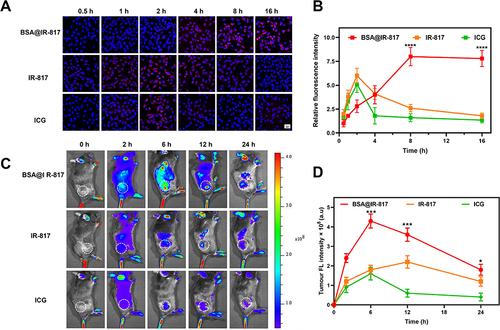
Figure 4 Evaluations BSA@IR-817 photothermal properties. (A) Temperature increase of BSA@IR-817 (20 μM) in PBS under an 808 nm laser with different exposure intensities (0.5, 0.8, 1 W/cm2). (B) Temperature increase of BSA@IR-817 at different concentrations (0, 5, 10, and 20 μM) under an 808 nm laser (1 W/cm2). (C) Temperature change of BSA@IR-817, IR-817, ICG and BSA (20 μM) upon exposure to 808 nm laser (1 W/cm2) for different intervals. (D) Infrared thermal images of (C). (E) Temperature changes of BSA@IR-817, IR-817 and ICG during four circles of heating-cooling processes (1 W/cm2, 5 min). (F) Photothermal conversion efficiency (PCE) of BSA@IR-817, IR-817 and ICG (20 μM, 1 W/cm2). (G) Infrared thermographic images of the B16-F10 cell tumor-bearing mice after irradiation (1 W/cm2, 5 min). (H) Change in tumor temperature as a function of the irradiation time.
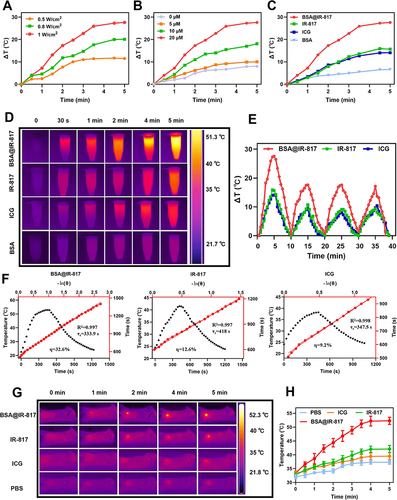
Figure 5 Photoinduced cytotoxicity of BSA@IR-817 in melanoma cells. (A) Viabilities of cancer cells incubated with BSA@IR-817 for 24 h. (B) Photoinduced toxicity of cancer cells treated with BSA@IR-817 of different concentrations following 808 nm laser irradiation (1 W/cm2) for 5 min and continued incubation for 24 h. (C) Fluorescence images of Calcein AM/PI co-stained A375 and B16-F10 cells with BSA@IR-817 (10 μM) incubation after being exposed to the 808 nm laser (1 W/cm2, 5 min). Values represent the mean ± SD, * p <0.05, ** p <0.01, *** p <0.001, **** p <0.0001, compared with the control group.
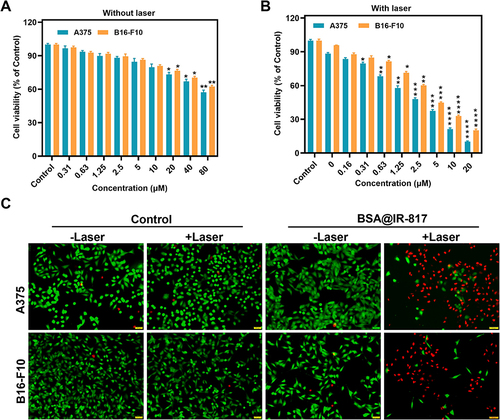
Figure 6 Photo-therapeutic efficacy evaluation of BSA@IR-817 in vivo. (A) Establishment of B16-F10 tumor-bearing mice model, administration, and laser irradiation to the mice. (B) Photos of mice bearing B16-F10 tumor and anatomic tumor on day 10 after various treatments as indicated. (C) The tumor growth in B16-F10 tumor-bearing mice treated by different formulations. (D) Tumor weight. (E) The tumor growth curves of each group. (F) Body weight changes of mice. (G) Blood safety evaluation of different concentrations of BSA@IR-817. (H) The survival curves of the tumor-bearing mice. Values represent the mean ± SD, *p <0.05, **p <0.01, ***p <0.001, ****p <0.0001.
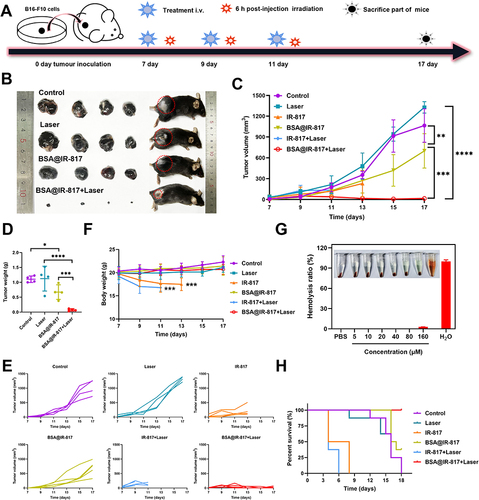
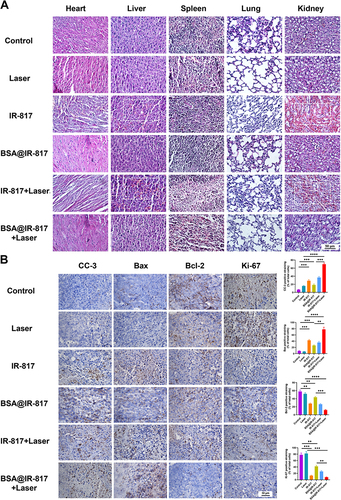
Figure 7 Histological analysis. (A) Representative histological features of the major organs of the tumor-bearing mice with various treatments. Scale bars, 50 μm (B) Ki-67, CC-3, Bax, and Bcl-2 immunohistochemical staining of tumor sections in the mice. Scale bars, 50 μm. Values represent the mean ± SD, n = 3. **p <0.01, ***p <0.001, ****p <0.0001.