Figures & data
Scheme 1 Schematic illustration of ICG@C3F8-R848 NBs construction, and as an efficient drug with US proposed antitumor strategy.
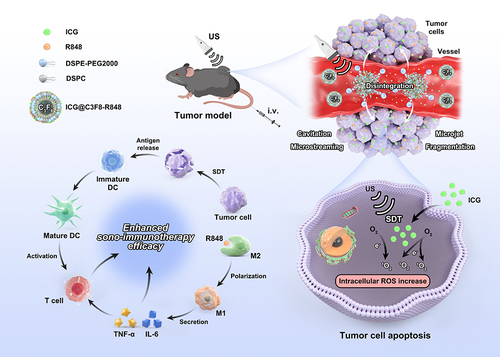
Figure 1 Preparation and characterization of ICG@C3F8-R848 NBs. (A) ICG@C3F8-R848 NBs were prepared based on the sonosensitizer of ICG and the TLR agonist of R848 through intermolecular interactions. (B) Transmission electron microscopy image showing a quasi-spherical morphology of ICG@C3F8-R848 NBs with a mean diameter of about 220 nm, Scale bar = 500 nm; (C) The DLS results showed a mean particle size of ICG@C3F8-R848 NBs to be 219.2±7.7 nm. (D) Size stability of the free NBs and ICG@C3F8-R848 NBs over 4 days. (E) Polydispersity value stability of free NBs and ICG@C3F8-R848 NBs over 4 days. (F) The Zeta potential of ICG@C3F8-R848 NBs to be −37.3±3.2 mV; (G) UV-vis spectra of ICG, NBs, ICG@C3F8 NBs and ICG@C3F8-R848 NBs. (H) Time-dependent SOSG absorption spectra in the presence of ICG@C3F8-R848 NBs under US irradiation for varied durations.
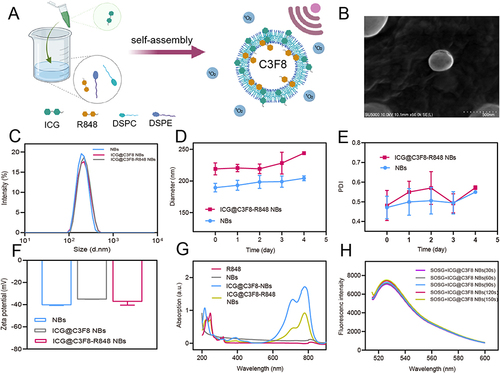
Figure 2 In vitro curative effect of the ICG@C3F8-R848 NBs upon SDT. (A) Fluorescence images analyses of intracellular ROS generation as indicated by DCFH-DA detection after receiving different treatments as indicated. (Scale bar = 50 μm). (B) Cytotoxicity analysis of differential treatments at different concentrations. (C) Representative fluorescence images of cells stained with calcein AM (green, live cells) and propidium iodide (red, dead cells) in different treatment (scale bar = 50 μm). (D) Fluorescence images of the JC-1 monomer (green channel), and aggregate (red channel) in the mitochondria of HCC cells after differential treatments as indicated. (scale bar = 50 μm). (E) The apoptotic frequency was analyzed by flow cytometry after different treatments. Total apoptosis rate was calculated by Q2 (early apoptosis) and Q3 (late apoptosis). (F) Quantification of the total apoptosis rates. Data are expressed as mean ± SD (n = 3). Statistical significances were calculated via one-way analysis of variance (ANOVA). *P < 0.05, ****P < 0.0001.
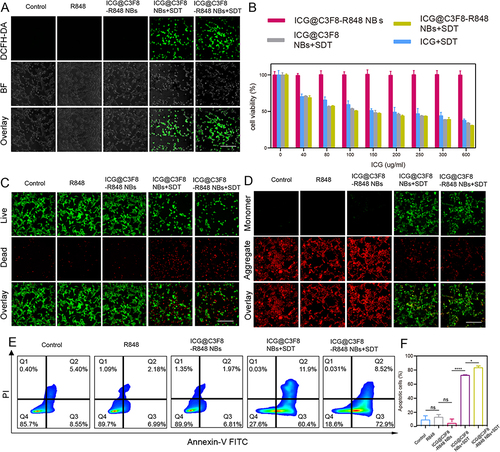
Figure 3 In vitro repolarization of M2 macrophages. (A) Flow cytometry and (B and C) quantitative analysis of M1 macrophages and M2 macrophages by CD86 marker and CD206 marker. (D–I) Relative expressions mRNA in M2 macrophages (Arg-1, CD163 and CD206) and M1 (CD86, IL-6 and TNF-α) as evaluated by qRT-PCR (n=3 biologically independent experiments). The data represent mean ± SD, one-way ANOVA, *P < 0.05, **P < 0.01, ***P < 0.001, ****P < 0.0001.
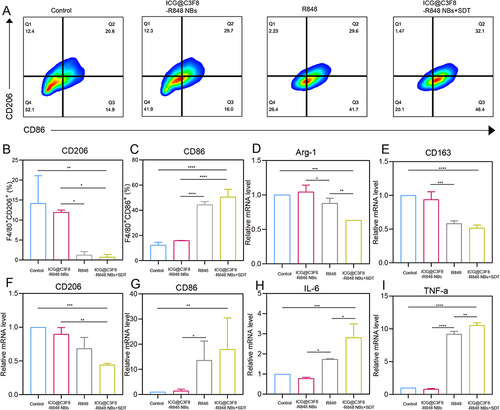
Figure 4 Experimental results of synergistic sono-immunotherapy in vivo. (A) Bioluminescence images of tumor-bearing mice in different groups at the 16 th days of the follow-up period. (B) Schematic illustration of synergistic sono-immunotherapy strategy against subcutaneous transplant tumor. (C) In vivo distribution of free ICG and ICG@C3F8-R848 NBs in tumor-bearing mice at different time points. (D) The fluorescence intensity of ICG@C3F8-R848 NBs and ICG alone in the tumor interior. Scale bar = 200 μm. (E) Tumour-growth curves of different groups of tumour-bearing mice after various treatments as indicated in the figure. (F) Weight of tumour-bearing mice of different groups after various treatments as indicated in the figure. (G and H) TUNEL and H&E staining for pathological changes in the tumor tissue. Scale bar = 10 μm. Scale bar = 100 μm.
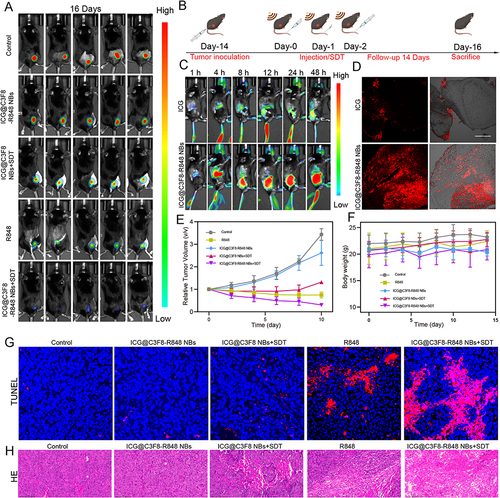
Figure 5 Analysis of immune cells in experimental animals after synergistic sono-immunotherapy. (A) Flow cytometry analysis of CD4+ T cells and CD8+ T cells. (B) Flow cytometry analysis of MDSCs by GR-1 marker. (C and D) Flow cytometry analysis of M1 macrophages and M2 macrophages by CD80 marker and CD206 marker.
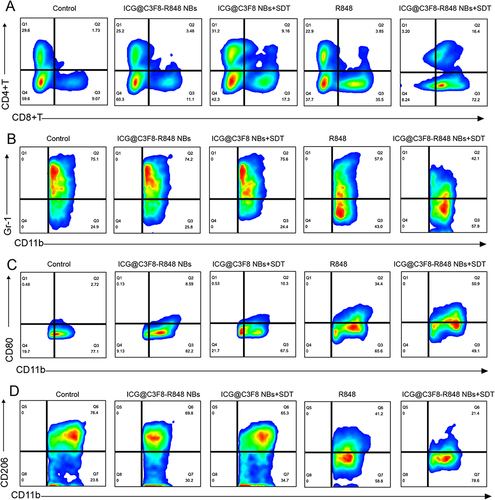
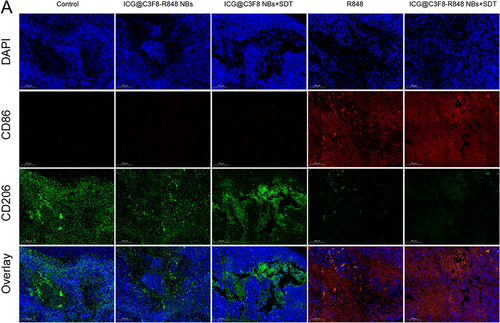
Figure 6 Analysis of immune cells in experimental animals after synergistic sono-immunotherapy. Representative immunofluorescence images of CD86 marker and CD206 marker expressions in the tumor tissues. Scale bars = 200 µm.