Figures & data
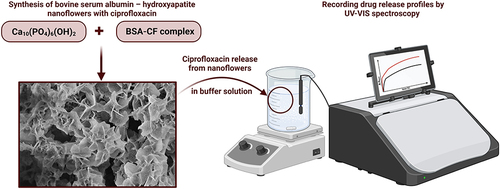
Figure 1 (A) Cyclic voltammograms recorded for 10–100 µM ciprofloxacin in PBS solution (10 mM, pH 7.4). The potential window from 0.2 to 1.3 V, scan rate 0.1 V/s. (B) Calibration curve based on CV scans.
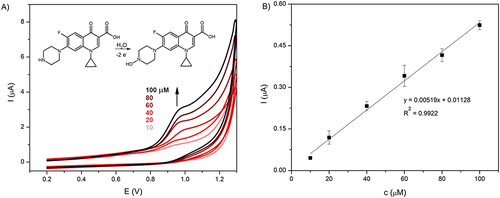
Figure 2 (A) Differential pulse voltammograms for 10–100 µM ciprofloxacin in PBS solution (10 mM, pH 7.4). Potential window 0.4–1.2 V. (B) Calibration curve based on DPV scans. (C) DPV plots for 100 µM ciprofloxacin in varying pH buffer values (7.4, 7, 6 and5).
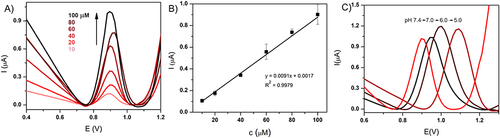
Figure 3 (A) UV‒Vis spectra for 100 µM ciprofloxacin solutions in 10 mM PBS pH 7.4 (black) and in 10 mM acetate buffer pH 5.0 (red). (B) Calibration curves based on UV‒Vis spectra.
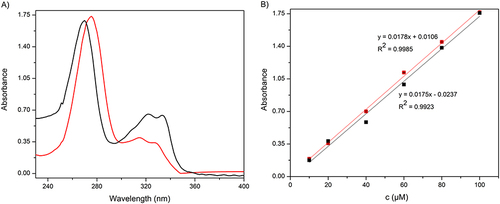
Figure 4 (A and B) SEM images of hybrid nanoflowers synthesized without ciprofloxacin. (C and D) SEM images of hybrid nanoflowers synthesized with ciprofloxacin.
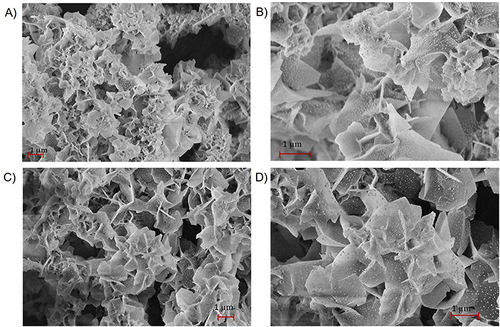
Figure 5 Illustration of the formation process of bovine serum albumin – hydroxyapatite nanoflowers. Created with BioRender.com.
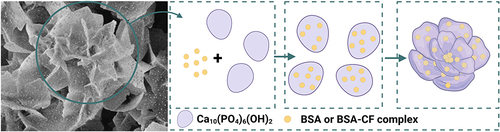
Figure 6 X-ray diffractogram of nanoflower sample in comparison to XRD pattern of hydroxyapatite (according to JCPDS 009–0432).
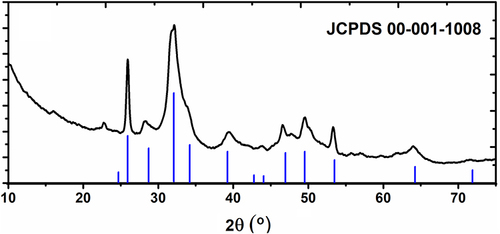
Figure 7 ATR-FTIR spectra of BSA, nanoflowers synthesized without ciprofloxacin, with ciprofloxacin and ciprofloxacin in the range 3650 cm−1 – 650 cm−1 (left), ATR-FTIR spectra in the range 1700 cm−1 – 650 cm−1 (right).
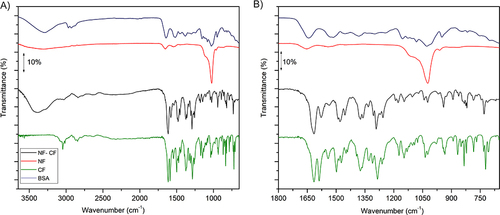
Figure 8 TG and DTG curves of CF (A), NF (C) and NF-CF (E). DSC curves of CF (B), NF (D) and NF-CF (F).
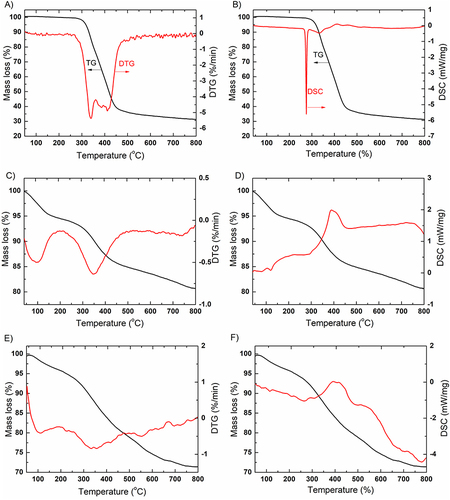
Figure 9 Release profile of ciprofloxacin from NF-CF (0.05 mg/mL) in 10 mM PBS pH 7.4 (black) and in 10 mM acetate buffer pH 5.0 (red).
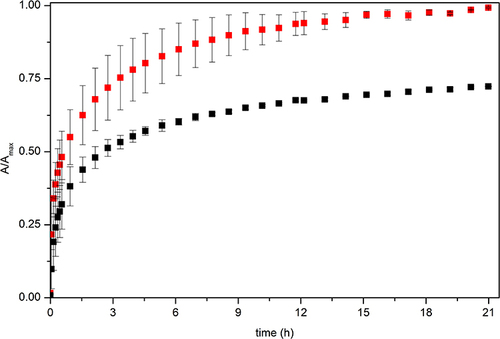
Figure 10 Susceptibility testing of P. aeruginosa (A) and S. aureus (B) using the disk diffusion method. The blank discs containing NF-CF, NF and free CF were used in the analysis. The inhibition zones (marked with circles) were present around NF-CF and CF only.
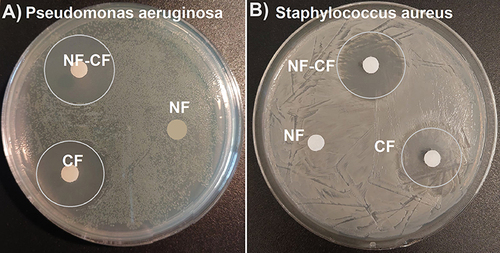
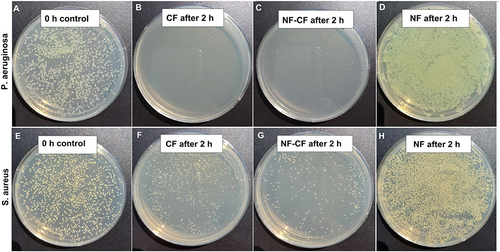
Figure 11 Antibacterial test based on CFU counting method. The initial CFU for both P. aeruginosa (A) and S. aureus (E) was around 5×10⁷ CFU/mL (around 300–500 colonies on dilution 1×10⁻⁴). CFU decrease of at least three orders of magnitude was observed after 2h of incubation in the presence of CF (B and F) or NF-CF (C and G). No influence -of NF on bacterial growth was observed (D and H).