Figures & data
Figure 1 Panning of specific nanobodies against the SARS-CoV-2 S1 protein by naïve nanobody library. (a) Schematic diagram of nanobody screening. (b) The anti-SARS-CoV-2 spike S1 nanobodies were enriched 149-fold after three rounds of screening. (c) Phage ELISA was used to identify an anti-SARS-CoV-2 S1 individual clone after three rounds of bio-panning. (d) SARS-CoV-2 S1 specific nanobodies were identified from the top 20 clones that were specifically bound to SARS-CoV-2 S1. (e) Alignment of the amino acid sequence of three screened SARS-CoV-2 S1 nanobodies.
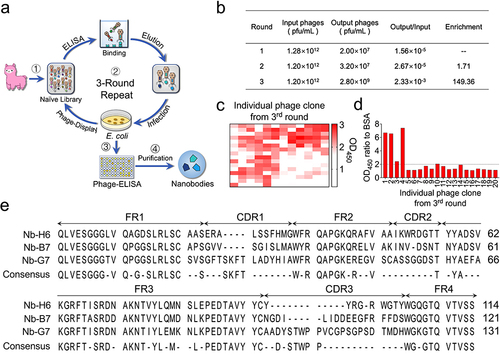
Figure 2 Purification and identification of the SARS-CoV-2 S1-specific nanobody. The top three nanobodies with the highest affinity for SARS-CoV-2 S1 were identified and named Nb-H6, Nb-G7, and Nb-B7. (a) SDS-PAGE analysis of purified nanobodies Nb-H6, Nb-G7, and Nb-B7. (M) Marker. The molecular weight (kDa) is indicated on the left-hand side. (b) The affinity of Nb-H6, Nb-G7, and Nb-B7 to SARS-CoV-2 S1 (left panel) and SARS-CoV-2 RBD (right panel) at various concentrations (200, 50, 12.5, 3.12, 0.78, 0.19, 0.049, and 0.012 nM). The results are presented as mean absorbance values at OD450 nm ± SD (n = 3).
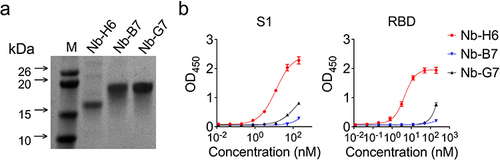
Figure 3 Characterization of the SARS-CoV-2 nanobody Nb-H6. (a) The binding kinetics of Nb-H6 with the immobilized SARS-CoV-2 S1 and RBD were measured using biolayer interferometry (BLI). (b) Competitive binding assays by ELISA. SARS-CoV-2 S1 (left panel) and RBD (right panel) bind to ACE2 after competitive blocking with serially diluted Nb-H6. IC50 values were calculated by nonlinear regression fitting to a variable slope, a four-parameter dose-response model. Data are presented as mean ± SD of three technical replicates. (c) Table summarizing the affinity KD, association (Kon), and dissociation constants (Koff) determined by BLI as well as the competition assay IC50 values for Nb-H6.
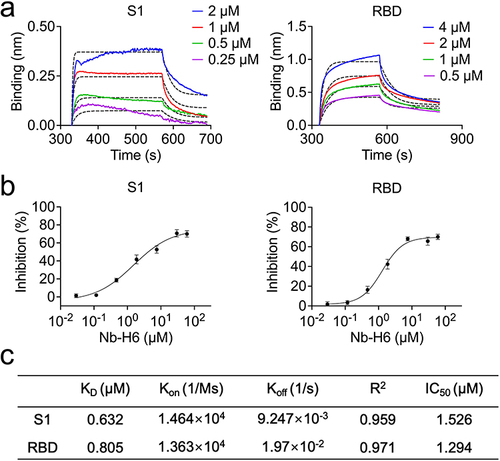
Figure 4 Evaluation of the thermal and pH stability of Nb-H6. Nb-H6 was incubated at different temperatures or pH levels, and the affinity of Nb-H6 binding to SARS-CoV-2 S1 was determined by ELISA. (a) Nb-H6 was incubated at 4, 30, 60, and 90 °C for 5 minutes; (b) Nb-H6 was incubated at 90 °C for 5, 15, 30, 45, 60, 75, 90, and 105 minutes; and (c) Nb-H6 was incubated at different pHs for 2 hours and the binding capacity was measured using ELISA. Data are shown as mean ± SD, n=3.
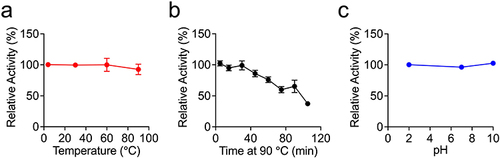
Figure 5 Nb-H6 suppresses SARS-CoV-2 infection in vitro. The SARS-CoV-2 spike pseudotyped GFP-luciferase lentivirus and authentic SARS-CoV-2 were mixed with serially diluted Nb-H6 and then infected host cells (HEK293-hACE2 and Vero E6, respectively) for infection. (a) Green fluorescence images were captured to visualize Nb-H6 neutralization against the SARS-CoV-2 pseudovirus (left panel), and the luciferase reaction assay was used to determine the IC50 value (right panel). Data are shown as mean ± SD (n = 3). (b) The authentic virus neutralization assay was performed to verify the anti-authentic SARS-CoV-2 ability of Nb-H6. Anti-SARS-CoV-2 N protein antibody and HRP-linked secondary antibody (left panel) were used to label the infected cells (left panel). For the calculation of the IC50, the foci were counted by the focus formation assay (FFA) (right panel). The scale bar in each image represents 200 μm. Data are shown as mean ± SD (n = 6). All IC50 values were calculated using a four-parameter logistic curve.
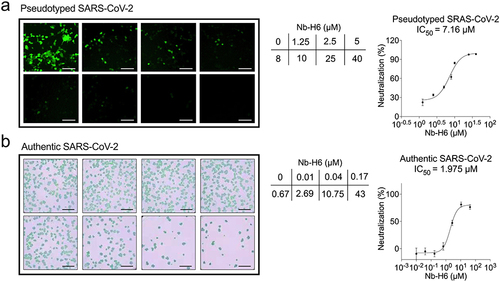
Figure 6 The binding activity of Nb-H6 with SARS-CoV-2 variants S1 and RBD. (a) The binding kinetics of Nb-H6 with the immobilized S1 of variants Alpha (B.1.1.7), Delta (B.1.617.2), Lambda (C.37), and Omicron (BA.2) were detected by BLI. (b) The binding capacity of Nb-H6 with RBD of variants Lambda (C.37), Delta (B.1.617.2), and Omicron (BA.2 and BA.5) was measured by BLI. (c) Table summarizing the affinity KD, association (Kon), and dissociation constants (Koff) determined by BLI.
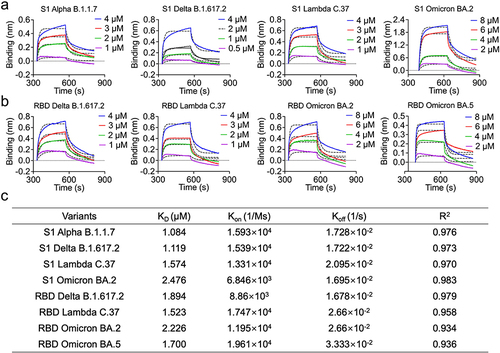
Figure 7 Nb-H6 inhibits SARS-CoV-2 variant pseudovirus infection. The SARS-CoV-2 variant spike pseudotyped GFP-luciferase lentivirus was incubated with different concentrations of Nb-H6 for 1 hour and subsequently infected HEK293-hACE2 cells for 6 hours to allow virus entry. Representative fluorescence images and dose-response curve for Nb-H6 neutralization of SARS-CoV-2 variants Alpha B.1.1.7 (a), Delta B.1.617.2 (b), Omicron BA.2 (c), and Omicron (BA.5) (d) pseudovirus at 48 hours post-infection. The scale bar in each image represents 200 μm. The IC50 was calculated using a four-parameter logistic curve. Data are shown as mean ± SD (n =3).
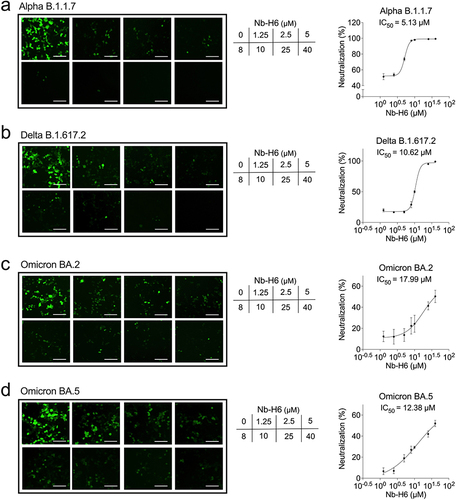
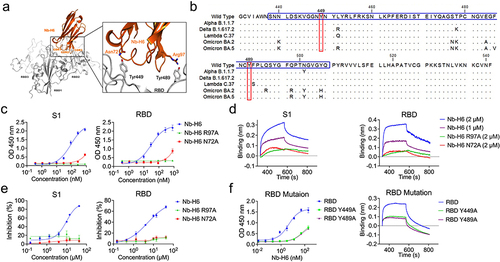
Figure 8 The amino acid residues Asn72 and Arg97 of Nb-H6 are critical for binding to SARS-CoV-2 RBD. (a) Predicted amino acids involved in the binding interactions between SARS-CoV-2 spike RBD (gray) and Nb-H6 (Orange). The Nb-H6 amino acid residues Asn72 and Arg97 are shown to form hydrogen bonds with the SARS-CoV-2 residues Tyr449 and Tyr489, respectively. (b) Amino acid sequence alignment of RBM (blue box) of wild-type and variant RBD. The conserved sites Y449 and Y489 were highlighted with a red box. (c) Affinity of Nb-H6 N72A or Nb-H6 R97A binding to SARS-CoV-2 S1 and RBD at various concentrations (800, 266.67, 88.89, 29.63, 9.88, 3.29, 1.10, and 0.37 nM), with Nb-H6 as a positive control. The results are presented as mean absorbance values at OD450 nm ± SD (n = 3). (d) Biolayer interferometry (BLI) was used to measure the binding kinetics of Nb-H6, Nb-H6 N72A, and Nb-H6 R97A with the immobilized SARS-CoV-2 spike S1 and RBD. (e) Competitive binding assays by ELISA. SARS-CoV-2 S1 (left panel) and RBD (right panel) bind to ACE2 after competitive blocking with serially diluted Nb-H6, Nb-H6 N72A, and Nb-H6 R97A. (f) The affinity of Nb-H6 binding to RBD mutants Y449A and Y489A was assessed by ELISA (left penal) and Biolayer interferometry (right penal). Nb-H6 was used at concentrations (400, 100, 25, 6.25, 1.56, 0.39, 0.10, and 0.02 nM) in ELISA, and results are presented as mean absorbance values at OD450 nm ± SD (n = 3). Data are presented as mean ± SD of three technical replicates.