Figures & data
Scheme 1 Schematic illustration of synthetic GelMA/POM hydrogel induction of bone defect repair and the mechanism of osteogenic induction.
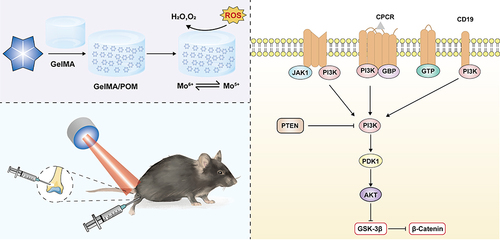
Table 1 Primers for Real-Time PCR
Figure 1 Characterization of POM and GelMA/POM hydrogel. (A) POM images were taken at pH = 7.5 by TEM; scale bar: 20 nm. (B) POM before and after incubation with H2O2. (C) X-ray photoelectron spectroscopy of POM incubating with or without ROS. (D) GelMA/POM before and after blue light exposure. (E) Surface plasmon absorption of mixed solution with POM and GelMA. (F) SEM images of GelMA and GelMA/POM hydrogel. (G) Amount of cumulative released POM. (H) The total antioxidant capacity of GelMA, POM and GelMA/POM. (*And #Indicate p < 0.05 in comparison with the GelMA and POM group, respectively.).
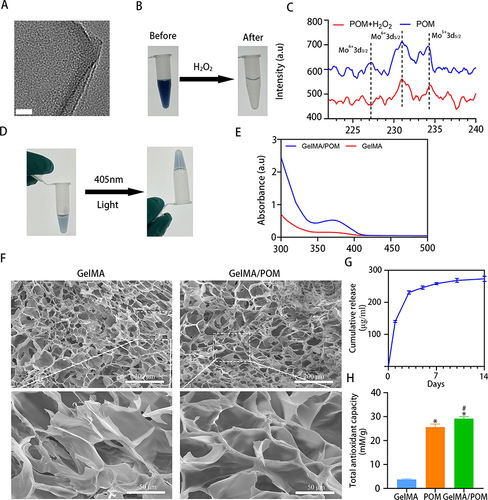
Figure 2 Cytocompatibility of POM and GelMA/POM hydrogel. (A) Cell survival was analyzed at different POM concentrations by using the CCK8 kit. (B) The CCK8 assay showing proliferation behavior of MC3T3-E1 cultured on different hydrogels. (C) Quantitative analysis of live cells. (D) Live/dead staining of cells on the different hydrogels after 3 days of incubation. (E) LSCM images of cytoskeleton and nuclei, showing the MC3T3-E1 cells cultured on the surface of the different hydrogels. (n = 3, each group). (Control, cells cultured on the tissue culture plate). Scale bar: 100 μm (D), and 100 μm (E).
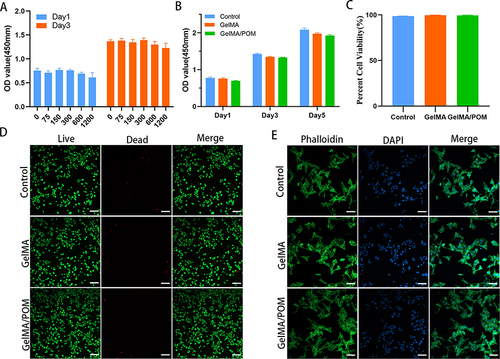
Figure 3 Antioxidant properties of POM or hydrogel. (A) DCFH-DA assay showing intracellular ROS of MC3T3-E1 after incubation with POM in the presence of H2O2 (100 μM). (B) Quantification analysis of DCFH-DA staining (*And #Indicate p < 0.05 in comparison with the H2O2 group and GelMA group, respectively.) (C) Cell capacity of migration (scratch test). (D) Quantitative analysis of percent migration in scratch assay. (*And #Indicate p < 0.05 in comparison with the H2O2 group and GelMA group, respectively.) (E) Live/dead staining showing MC3T3-E1 cell viability after culturing on hydrogel in the presence of H2O2. (F) Quantification analysis of live cells. (*And #Indicate p < 0.05 in comparison with the H2O2 group and GelMA group, respectively.) (G) LSCM images showing MC3T3-E1 cultured on different hydrogels following H2O2 treatment. (n = 3, each group). (H2O2, cells cultured on the tissue culture plate with H2O2). Scale bar: 200 μm (A), 200 μm (C), 100 μm (E) and 100 μm (G).
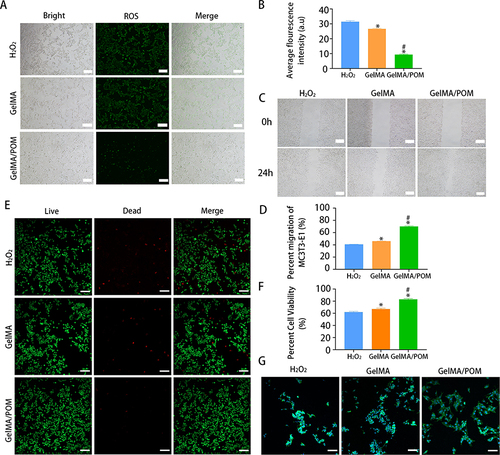
Figure 4 The osteogenesis properties of GelMA/POM hydrogel in vitro. In vitro assay of effects of hydrogel on ALP activity and extracellular calcium nodule production during osteogenesis differentiation of MC3T3-E1. (A) Alizarin red S staining. (B) Quantitative analysis of mineralized nodules. (C) Alkaline phosphatase activity. (D) Alkaline phosphatase staining. (*,# And a indicate p < 0.05 in comparison with the Control group, H2O2 group and GelMA group respectively). (Control, cells cultured without H2O2). (n = 3, each group). Scale bar: 200 μm (A) and 200 μm (D).
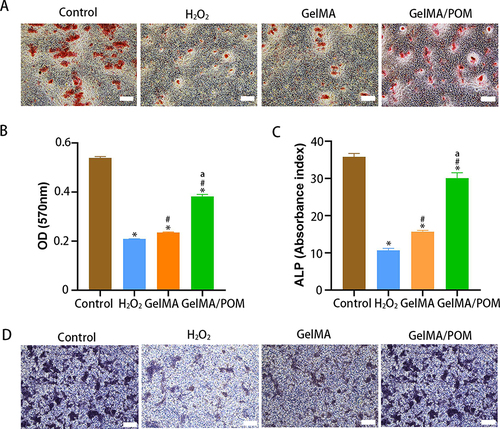
Figure 5 Transcriptome analysis of the GelMA/POM hydrogel to promote bone repair. (A) The differentially expressed genes in GelMA/POM group compared to GelMA group. (B) GO analysis of differentially expressed genes between the two groups. (C) mRNA levels of the osteogenesis-related genes RUNX2, BMP2, Osterix, and ALP, as determined by real-time PCR. (D) Q-value enrichment map of GelMA/POM. The enrichment ratio was calculated as (differentially expressed genes in this pathway/all differentially expressed genes)/ (genes annotated to this pathway/all annotated genes). (E) KEGG enrichment analysis of GelMA/POM group compared with GelMA group. (Rectangular box highlights significant differential expression genes.) (F) Relative mRNA levels of the PI3K/Akt signaling factors β-catenin, PTEN and GSK-3β, as determined by real-time PCR. (*And #Indicate p < 0.05 in comparison with Control group and GelMA group, respectively.) (n = 3, each group).
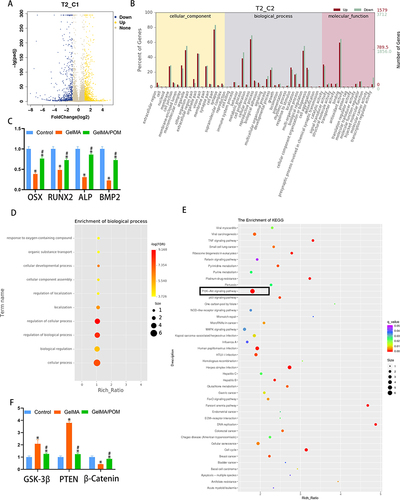
Figure 6 The osteogenesis properties of hydrogel in vivo. (A) 3D reconstructed images showing the effects of different hydrogel on the new bone tissue formation inside the defect site. The bone defect area was circled by red shading. (B) Bone mineral density at 2 and 4 weeks. (n = 3, each group). (C) Bone volume fraction at 2 and 4 weeks. (*And #Indicate p < 0.05 in comparison with Control group and GelMA group, respectively.).
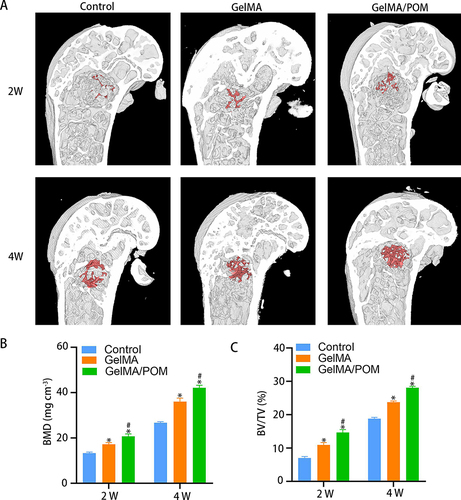
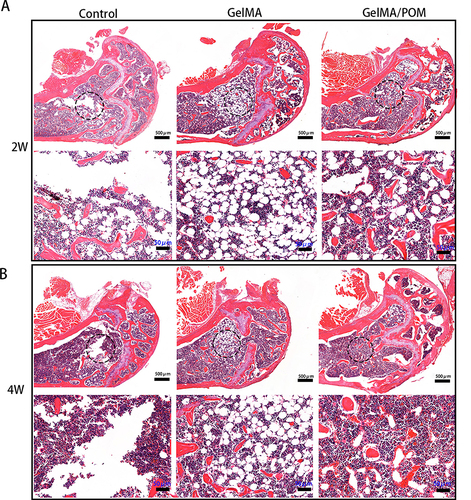
Figure 7 Histomorphological analysis of newly formed tissue by hematoxylin-eosin staining. Images of HE staining in the distal femur defect area at 2 weeks (A) and 4 weeks (B) postoperatively.