Figures & data
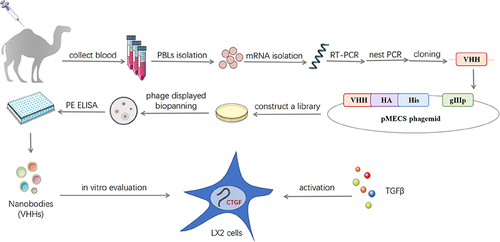
Table 1 Primer Sequences Used for Quantitative RT-PCR in This Study
Figure 1 Construction and screening of VHH library. (A) Schematic depictions of the immunization and screening strategy used to isolate anti-CTGF Nbs. PBLs, peripheral blood lymphocytes. The cropping gel of purified CTGF-domain II-Fc antigen is displayed. (B) The segments containing VHH gene fragments were amplified by a first PCR. (C) The fragments were then amplified by a second PCR. (D) The capacity of library 1 and 2 was estimated by counting colony numbers after serial dilutions and plating on plates containing selective antibodies. (E) The correct insertion rates of library 1 and 2 were estimated by performing PCR on randomly selected 24 colonies. Clones were randomly selected to detect the percentage of clones with a phagemid containing an insert of a proper size for a VHH. (F) The enrichment for phage particles of library 1 and 2 was detected after three consecutive rounds of panning. Land M DNA marker. +: positive screened phages transformed into TG1 cells after panning with CTGF-Fc. -: negative screened phages panning with Fc were used as control.
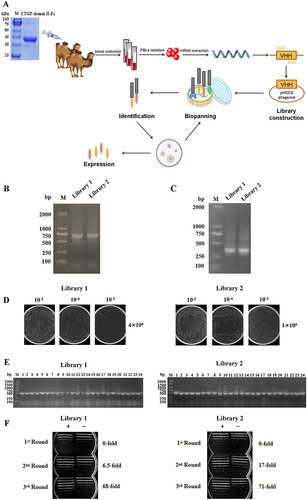
Figure 2 Functional activity identification of anti-CTGF Nb. (A) SDS-PAGE gel analysis for the purified anti-CTGF Nb. Lane 1 was loaded with protein marker (M); lane 2 exhibited purified human CTGF-domain II-Fc antigen. The samples were separated by using 10% gradient PAGE gels and stained with Coomassie blue. (B) The affinity of CTGF nanobody was detected by Fortebio detection. The experiment was performed in triplicate and one representative experiment was shown. (C) The specificity of anti-CTGF Nb to human CTGF and mouse CTGF was detected by ELISA. (D) The epitope competition assays of CTGF nanobody with the reference antibody pamrevlumab analog.
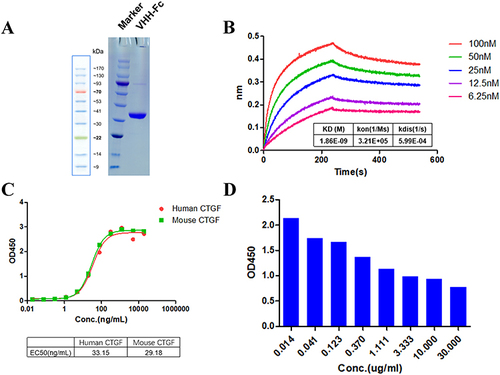
Figure 3 Effect of anti-CTGF Nb on proliferation and migration of LX-2 cells treated with TGFβ1. (A) CCK-8 assays showed proliferation change of cells. LX-2 cells were treated with the increased concentration of TGFβ1 (1, 2, 5, and 10 ng/mL) or an equal volume of PBS for 24 h. (B) Effect of anti-CTGF Nb at various concentrations (1, 5, and 10 μg/mL) on the proliferation of TGFβ1-treated LX-2 cells was determined by CCK-8 assay after 24, 48 or 72 h. (C) Morphology of LX-2 cells under different treatments for 24 h. (D) The migration rate of cells was detected by wound-healing test. Representative microphotographs showing the wound closure distance at 0h and 24 h post wounding. Dashed lines indicate initial wounds. Morphometrical analysis was performed to measure the remnant wounding area. The migration rate is shown as % of initial wounding area. (E) Cell mobility was detected by Transwell assay. Scale bars: 100 μm. All data are presented as mean ± SD from three independent experiments. #p < 0.05, ##p < 0.01 vs the control group; *p < 0.05, **p < 0.01 vs the TGFβ1 group.
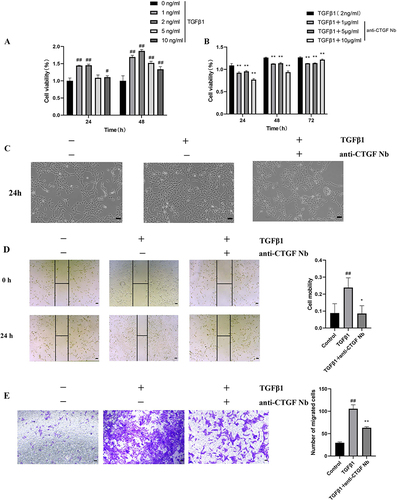
Figure 4 Effects of anti-CTGF Nb on the activation of LX-2 cells and fibrogenesis. (A and B) Western blot analysis for αSMA, COL1A1, MMP9, Smad2, and Smad3 in LX-2 cells; β-actin as loading control. (C) The mRNA levels of αSMA, COL1A1, Smad2, Smad3 were detected by qRT-PCR. Results were normalized to the GAPDH mRNA and expressed as fold change compared to control group. (D) Representative immunofluorescence staining of CTGF (green). Nuclei were stained with 4’, 6-diamidino-2-phenylindole (DAPI) (blue). Scale bars: 50 μm. (E) Representative immunofluorescence staining of αSMA (red). Nuclei were stained with DAPI (blue). Scale bars: 50 μm. ##p < 0.01 vs the control group; *p < 0.05, **p < 0.01 vs the TGFβ1 group.
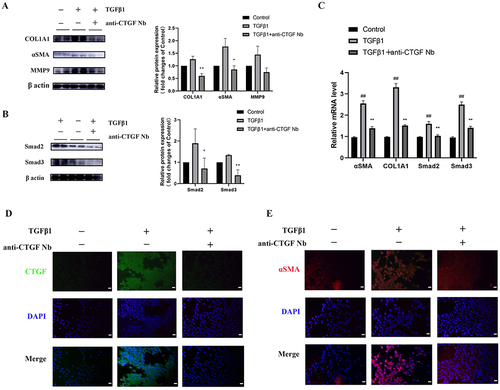
Figure 5 Effects of anti-CTGF Nb on apoptosis of LX-2 cells in response to TGFβ1. (A) The cytotoxic effect of anti-CTGF Nb in LX-2 cells was determined by CCK-8 assay at various concentrations (0, 1, 5, and 10 µg/mL) for 24 h and 48 h. (B) Representative Western blots showing cellular extracts cleaved caspase-3, and β-actin as loading control. (C) Anti-CTGF Nb (5 µg/mL) increased the rate of apoptosis in activated LX-2 cells in response to TGFβ1 (2 ng/mL) for 24 h. Cell apoptosis was detected using a Annexin V-FITC Apoptosis Detection Kit. The results are shown as the mean ± SD from three independent experiments. **p < 0.01 vs the TGFβ1 group.
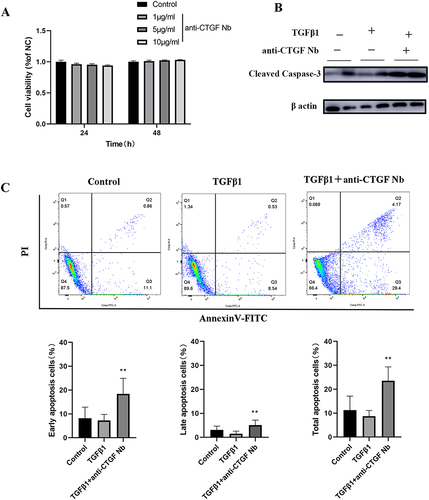
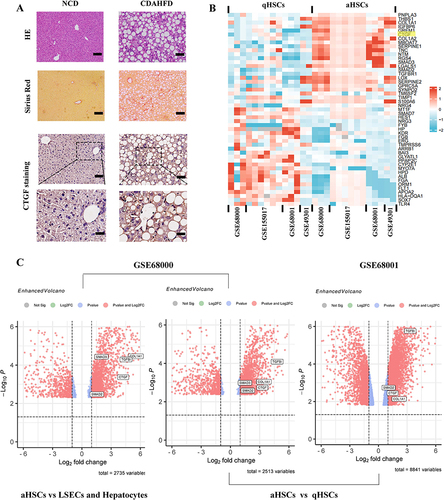
Figure 6 Expression and function identifications of CTGF in NASH liver fibrosis model of mice and human. (A) Histology of liver sections from NCD or CDAHFD-fed mice stained for CTGF, H&E, as well as Sirius red staining. Insert showing the typical CTGF-positive cells, lobular inflammation, and pericellular fibrosis. Scale bars: 100 μm (up 3 panels) and 200 μm (bottom panel). (B) Heatmap depicting the representative DEGs (sorted by fold change and p value) in the human quiescent HSCs (qHSCs) and human activated HSCs (aHSCs). CTGF is among the top DEGs and is highlighted in yellow. Database-based gene expression analysis was conducted using public data sets obtained from GEO at site the NCBI (http://www.ncbi.nlm.nih.gov/geo/). (C) Volcano plots of DEGs between human activated HSCs (aHSCs) and human hepatocytes, liver sinusoidal endothelial cells (LSECs) (from GSE68000), and DEGs between human activated HSCs (aHSCs) and human quiescent HSCs (qHSCs) (from GSE68000 and GSE68001 respectively). Representative fibrogenesis-related genes including CTGF are labeled in the plots.