Figures & data
Figure 1 SEM images of the CPC–FG composites at different P/L ratio and the pure CPC fresh prepared.
Notes: Red arrow: FG; green arrow: CPC.
Abbreviations: SEM, scanning electron microscope; CPC, calcium phosphate cement; FG, fibrin glue; P/L, powder/liquid.
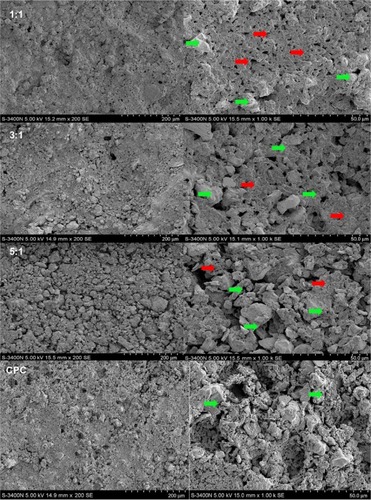
Figure 2 Compressive strength and the elastic modulus (n = 5).
Note: *Significance at P < 0.05.
Abbreviations: n, number; MPa, compressive strength; GPa, elastic modulus.
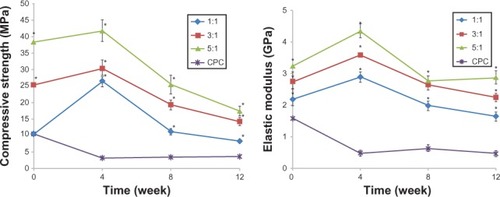
Figure 3 Reconstruction the cross section images of rabbit femur and residual material of the composite by micro-CT analysis at 4 weeks after the operation.
Abbreviations: CT, computed tomography; CPC, calcium phosphate cement.
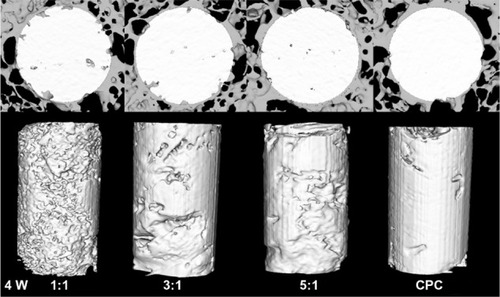
Figure 4 Reconstruction of the cross-sectional images of rabbit femur and residual material of the composite by micro-CT analysis at 8 weeks after the operation.
Abbreviations: CT, computed tomography; CPC, calcium phosphate cement.
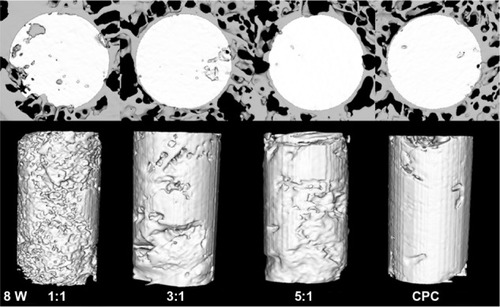
Figure 5 Reconstruction of the cross-sectional images of rabbit femur and residual material of the composite by micro-CT analysis at 12 weeks after the operation.
Abbreviations: CT, computed tomography; CPC, calcium phosphate cement.
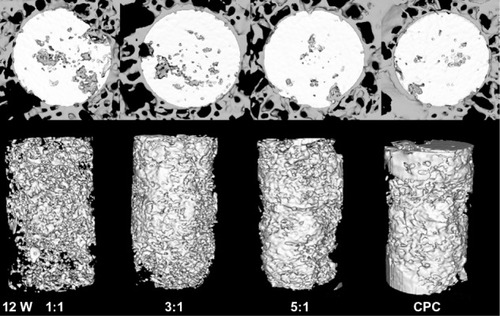
Figure 6 Results of RMVF and BV/TV from micro-CT analysis (n = 5).
Notes: RMVF evaluated the degradation of the material; BV/TV evaluated the new bone formation. The CPC group was the control group. *The significance between the 1:1 group and the CPC group (P < 0.05); #the significance between the 1:1 group and the CPC group (P < 0.05). The symbol “ns” represented the significance between the 1:1 group and the CPC group (P < 0.05).
Abbreviations: RMVF, residual material volume fraction; BV, bone volume; TV, trabecular (total) volume; CT, computed tomography; n, number; CPC, calcium phosphate cement.
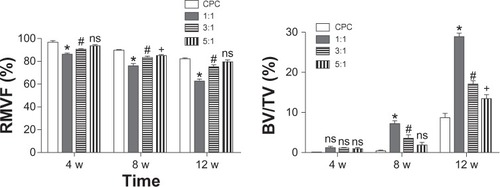
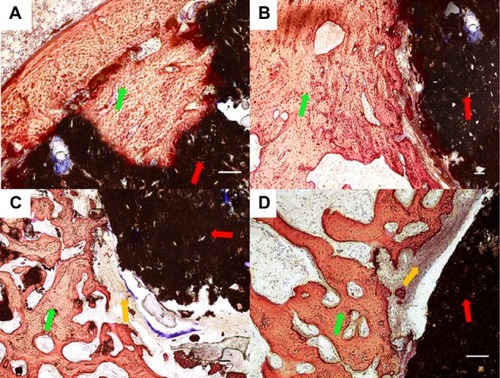
Figure 7 Histological morphologies after implantation at 4 weeks. (A) The 1:1 P/L ratio of CPC–FG; (B) 3:1 P/L ratio of CPC–FG; (C) 5:1 P/L ratio of CPC–FG; (D) pure CPC.
Notes: The green star indicates cartilage; the red arrow represents materials; the yellow arrow indicates fibrous tissue; and the green arrow represents bone. Bars = 100 μm.
Abbreviations: CPC, calcium phosphate cement; FG, fibrin glue; P/L, powder/liquid.
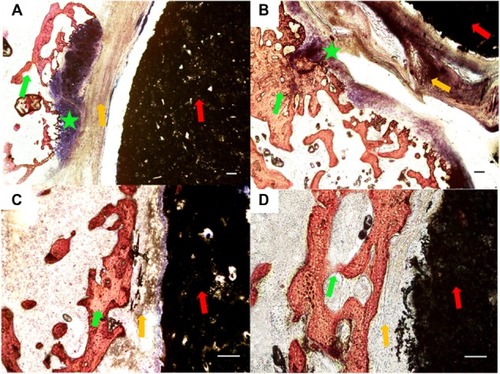
Figure 8 Histological morphologies after implantation at 8 weeks. (A) The 1:1 P/L ratio of CPC–FG; (B) 3:1 P/L ratio of CPC–FG; (C) 5:1 P/L ratio of CPC–FG; (D) pure CPC.
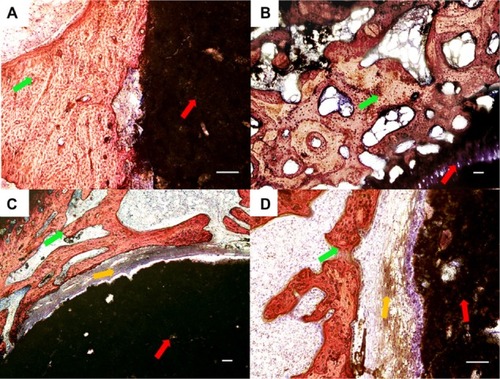
Figure 9 Histological morphologies after implantation at 12 weeks. (A) The 1:1 P/L ratio of CPC–FG; (B) 3:1 P/L ratio of CPC–FG; (C) 5:1 P/L ratio of CPC–FG; (D) pure CPC.