Figures & data
Scheme 1 Self-assembly and radiolabeling of ICG-HSA NPs and their applications for SLN Imaging.
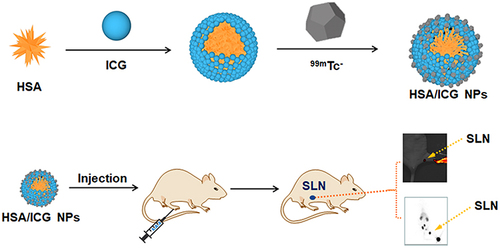
Figure 1 Characterizations of the synthesized ICG-HSA NPs. (A) TEM image of the synthesized ICG-HSA NPs; (B) Size distribution of ICG-HSA NPs measured by DLS (1 - HSA protein, 2 - ICG-HSA NPs); (C) Absorption and emission spectra of ICG in PBS. The spectra were normalized at the maximum absorption and emission; (D) Absorption and emission spectra of ICG-HSA NPs. The spectra were normalized at the maximum absorption and emission.
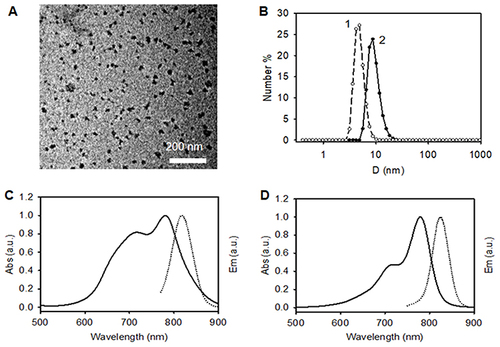
Table 1 Effects of ICG-HSA NPs on Body Weight of ICR Mice (n = 20, Mean ± SD)
Figure 2 Dynamic fluorescence images of ICG-HSA NPs for mice SLN and slice examination of SLN. (A) The dynamic imaging of fluorescence from 1 minute to 60 minutes. The fluorescence signal of ICG-HSA NPs in popliteal LNs can be seen 1 min after injection, and the fluorescence signal increases continuously over time. Arrows indicate the popliteal LNs; (B) From left to right: DAPI, FITC-ICG-HSA NPs fluorescence, overlay images, and H&E staining of popliteal LN tissue sections (40x magnification).
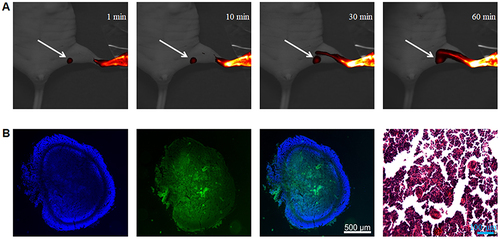
Figure 3 Fluorescence imaging of ICG-HSA NPs guiding SLN resection surgery and slice examination. (A) Visible light, fluorescence signals, and their real-time overlay pictures in the ICG-HSA NPs -guided SLN resection. (B) Visible light, fluorescence signals, and their real-time overlay during right iliac fossa lymphadenectomy guided by ICG-HSA NPs. (C) From top to bottom are the visible light, fluorescence signals, and their real-time overlay of the left thigh muscle, SLN, and second-tier LN. (D–F) H&E staining images of the SLN, second-tier LN, and left thigh muscle, respectively.
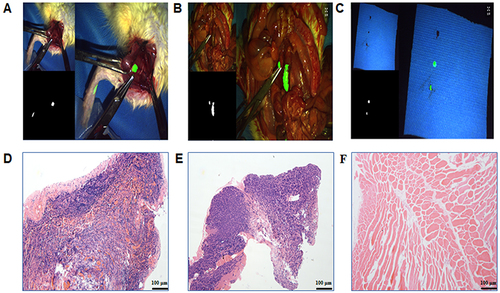
Figure 4 99mTc-ICG-HSA NPs sentinel lymphoscintigraphy analysis. (A) SPECT/CT fusion image of 99mTc-ICG-HSA NPs at 1 h post plantar injection; (B) Radioactivity counts of 99mTc-ICG-HSA NPs in various tissues and organs in vivo at 24 h post-injection. n = 3 in each group; (C) Biodistribution of 99mTc-ICG-HSA NPs in various tissues and organs at 24 h post-injection. n = 3 in each group. The data are shown as mean ± SD.
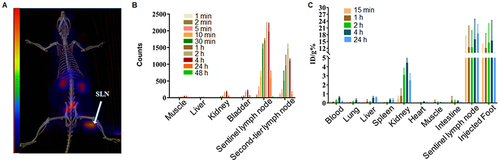
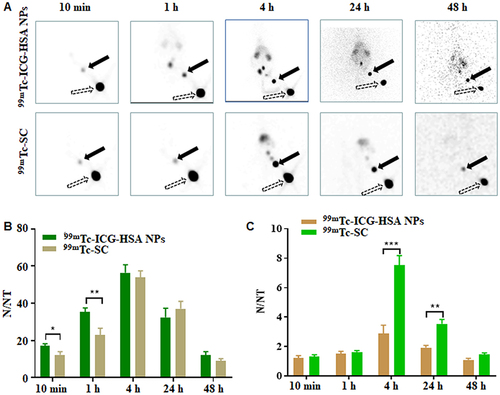
Figure 5 Comparisons of longitudinal planar imaging of rats for SLNs with 99mTc-ICG-HSA NPs and 99mTc-SC. (A) Planar imaging of SLNs with 99mTc-ICG-HSA NPs or 99mTc-SC. The solid arrows indicate the popliteal LNs and the dash arrows indicate the injection sites; (B) T/NT of SLNs to right thigh muscles in rats of 99mTc-ICG-HSA NPs and 99mTc-SC scintigraphy; (C) T/NT of livers to right thigh muscles in rats of 99mTc-ICG-HSA NPs and 99mTc-SC scintigraphy. N/NT = Target-to-non-target ratio. The data are shown as mean ± SD, ***P<0.001, **P<0.01, *P<0.05.