Figures & data
Table 1 The Independent Variables with the Actual Values of Their Experimental Level Codes
Figure 1 The experimental timeline.
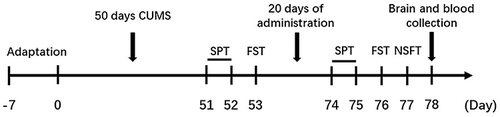
Figure 2 (A) Degradation curves of CU in mixtures of CU, DMC and BDMC with different ratios and in TUR. (B) The effect of Vit C, CU and TUR solution on scavenging ability of ABTS•+ radicals. (C) The protective effects of CU, TUR and fluoxetine hydrochloride on H2O2-induced cell injury model. Compared with control group: **P < 0.05, compared with H2O2 group: #P < 0.05. (D) The inhibition rate of fluoxetine hydrochloride on different concentrations of ASP+. (E) The inhibition rate of CU and TUR on ASP+. The line: the inhibition rate of fluoxetine hydrochloride on 100 μM ASP+. Compared with fluoxetine hydrochloride on ASP+: *P < 0.05, **P< 0.01.
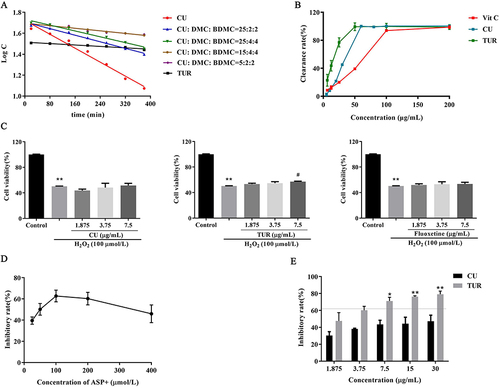
Table 2 Single Factor Analysis of the TUR-NE Preparation Process
Table 3 Single Factor Analysis of the TUR-NE Prescription
Table 4 Experimental Design and the Experimental Values of Response Variables
Table 5 Analysis of Variance (ANOVA) for the Quadratic Model
Figure 3 The response surface plots of the effect for the independent variable on EE (A-F) and PDI (G-L).
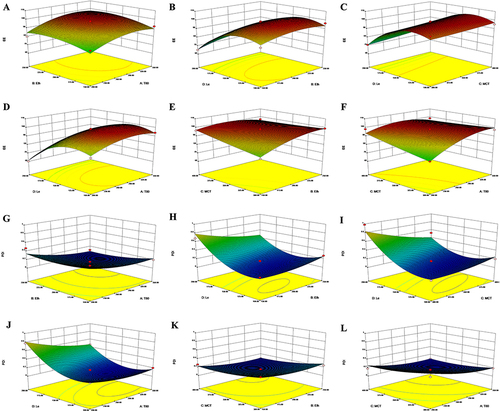
Figure 4 (A) Size and (B) Zeta potential of TUR-NE. (C) TEM image of TUR-NE (12,000 × magnification). (D) Accumulative release rate for TUR and TUR-NE in HCl (PH 1.2) and PBS (PH 7.4). The variation in (E) size, (F) PDI, (G) EE, and (H) LE of TUR-NE during stability study.
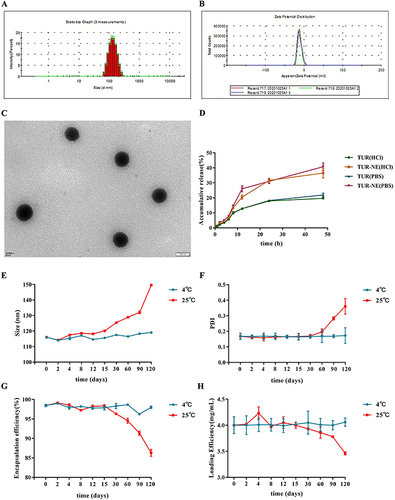
Table 6 The Main Pharmacokinetic Parameters of CU, TUR, and TUR-NE
Figure 5 (A) The plasma concentration-time curves of CU after given CU, TUR, and TUR-NE by oral administration. (B) The sucrose preference value of the CUMS model mice in SPT. (C) The immobility time of the CUMS model mice in FST. (D-F) The depression-like and anxiety-like behaviors were improved after administration. (D) The sucrose preference value of the mice in SPT, (E) the immobility time of the mice in FST, (F) the latency time to feed of the mice in NSFT. (G-J) The levels of 5-HT and MAO in plasma and brain of the mice. Compared with control group: **P < 0.01, compared with CUMS model group: #P < 0.05, ##P < 0.01.
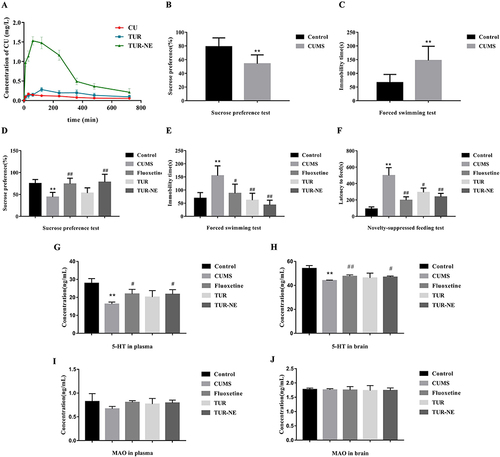
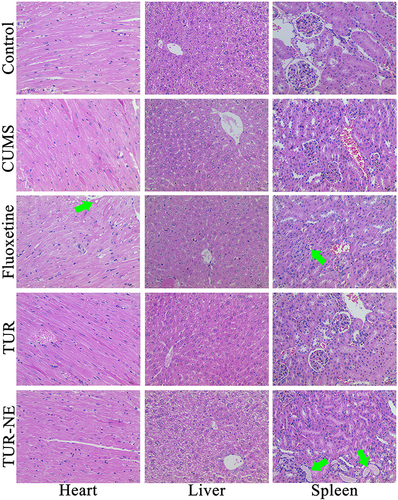
Figure 6 Pathological section images of heart, liver, and kidney in mice (400 × magnification). The green arrow: slight degeneration of the tissue organs.