Figures & data
Table 1 Composition (% w/w) of Polymeric Blends Used to Obtain the Clay-Doped Scaffolds
Figure 1 Undoped (CHS) and doped scaffolds with hectorite (CHS-HEC) or montmorillonite (CHS-MMT): (a) SEM micrographs of nanofibers (mag. 10kx). In the inset the fiber diameters are reported; (b) SEM micrographs of nanofibers (mag. 25kx); PBS; (c) SEM- EDX spectra (mag. 25kx); (d) TEM micrographs (scale bar 2 µm in CHS and 1 µm in clay-doped fibers).
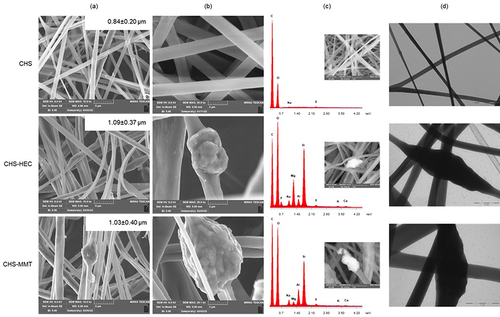
Figure 2 FT-IR (a) and XRPD (b) spectra of undoped (CHS), hectorite-doped (CHS-HEC) and montmorillonite-doped (CHS-MMT) scaffolds. The spectra are compared to pristine hectorite (HEC) and montmorillonite (MMT).
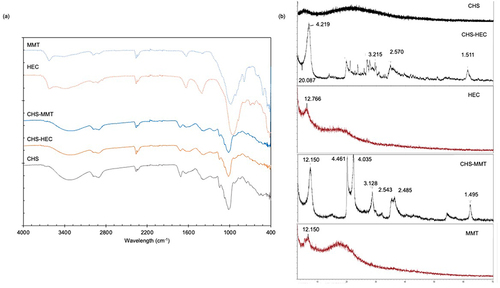
Figure 3 MSD (left panel) and force constants (right panel) calculated for CHS (filled symbols/columns), CHS-HEC (pattern symbols/columns), and CHS-MMT (empty symbols/columns). Purple= dry scaffolds; Blue: samples hydrated in D2O; Green = samples hydrated in H2O.
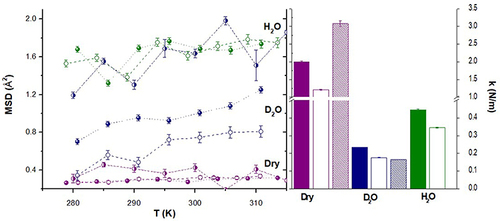
Figure 4 DSC spectra (a) and TGA spectra (b) of undoped (CHS), hectorite-doped (CHS-HEC) and montmorillonite-doped (CHS-MMT) scaffolds. The inset shows the % of mass residues that correspond to the clay loaded.
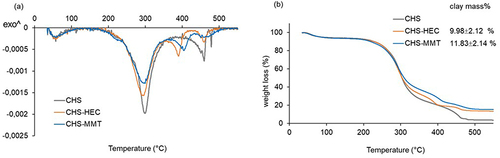
Figure 5 (a) SEM micrographs of the scaffolds after hydration in water; (b) fiber swelling (mean values ± s.d.; n=4%); (c) contact angles (θ°) vs times in water; (d) digital images, after 300 ms, 1500 ms and 3000 ms from the water droplet-release on the undoped (CHS), hectorite-doped (CHS-HEC) and montmorillonite-doped scaffolds (CHS-MMT) (1-way Anova, post hoc Scheffè test (mean values ± s.d.; n=4; *p<0.05 **p<0.01).
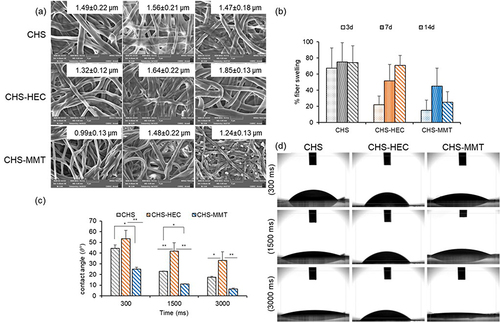
Figure 6 Zeta potentials ζ(mV) of undoped (CHS) or hectorite (CHS-HEC) or montmorillonite (CHS-MMT) doped scaffolds over a pH range of 2 to 9; the inset shows the isoelectric point values (IEP) of the 3 different formulations (1-way Anova, post hoc Scheffè *p<0.05; mean values ± s.d.; n=3).
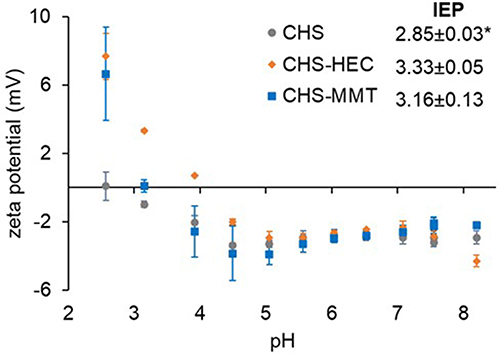
Figure 7 % Glucosamine released by the time (mean values ± s.d.; n=4) (a); SEM micrographs of scaffolds after 14 day of lysozyme degradation (b): CHS; CHS-HEC; CHS-MMT.
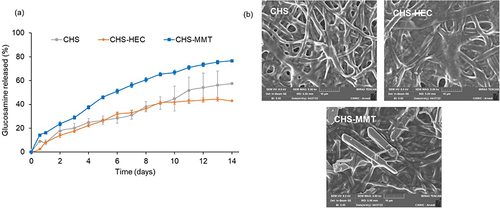
Figure 8 (a) µg of protein per mm2 of scaffold adhered after 15, 30 and 60 minutes. 1-way Anova – Test W-test *p<0.01 (mean values ± s.d.; n=4); (b) zeta potential (mV) at pH 7.4 before (pre-ads) and after 60 minutes of contact with BSA (post-ads), of undoped (CHS), hectorite-doped (CHS-HEC) or montmorillonite-doped (CHS-MMT) scaffolds.1-way Anova -post hoc Scheffè test *p<0.01 (mean values ± s.d.; n = 4).
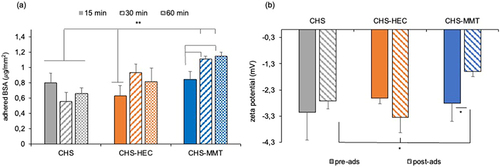
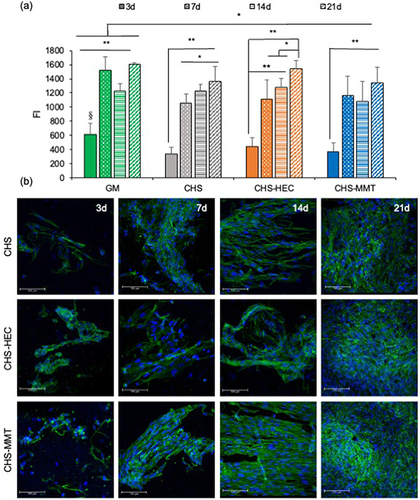
Figure 9 Fluorescence intensities (FI) of reduced alamarblue® (a) and CLSM micrographs (b) after 3, 7, 14 and 21 days of culture of normal human dermal fibroblasts (NHDF) onto undoped scaffolds (CHS) and doped with clays: hectorite (CHS-HEC) or montmorillonite (CHS-MMT). NHDF grown onto the bottom of the well were considered as control (GM) (mean values ± s.d.; n = 8; 1-way Anova, MRT test, **p<0.01; *p<0.05).