Figures & data
Figure 1 UV visible absorption spectra of silver nanoparticles. (A) Potato peel extracts; (B) coriander stem extract.
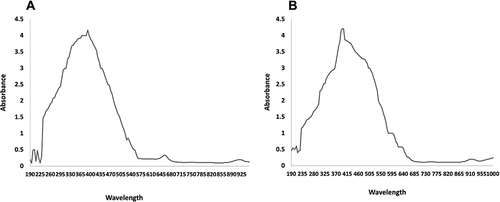
Figure 2 SEM images of silver nanoparticles. (A) Potato peel extracts; (B) coriander stem extract.
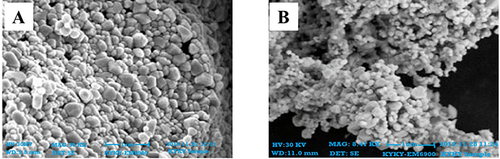
Figure 3 XRD analysis silver nanoparticles. (A) Potato peel extracts; (B) coriander stem extract.
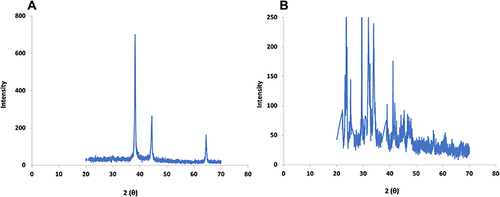
Figure 4 Total phenolic contents of nanoparticles and control extracts. Data are expressed as the mean ± SD. **p<0.01.
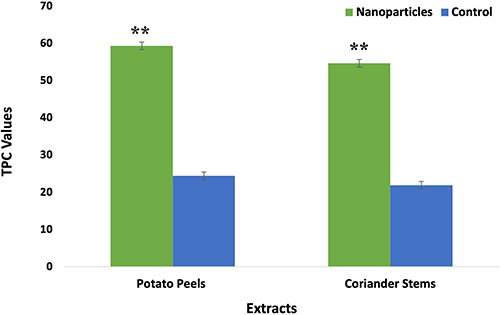
Figure 5 Total flavonoid contents of nanoparticles and control extracts. Data are expressed as the mean ± SD. **p< 0.01.
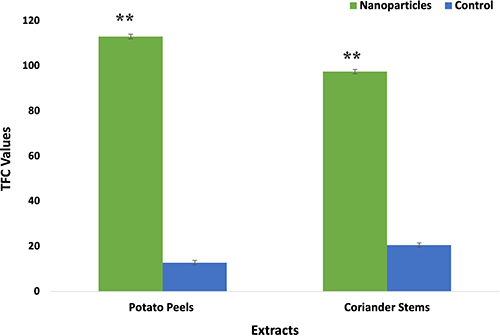
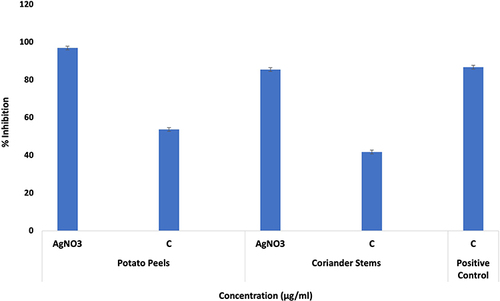
Figure 6 Comparative analysis of antioxidant activity of AgNPs and crude extracts. Data are expressed as the mean ± SD. **p< 0.01.
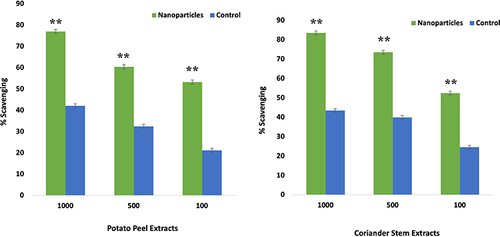
Table 1 Antibacterial Activity and MIC Values of Potato Peels, Coriander Stem and AgNPs
Table 2 Antifungal Activity and MIC Values of Potato Peels, Coriander Stem and AgNPs
Figure 7 Comparative analysis of cytotoxic activity of AgNPs and crude extracts. Data are expressed as the mean ± SD. */#p < 0.05, **p< 0.01.
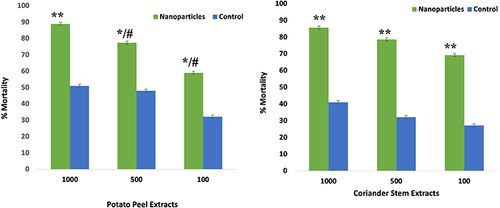
Figure 8 Comparative analysis of cytotoxicity activity of AgNPs and crude extracts on HEp2 Cell lines. Data are expressed as the mean ± SD. */#p< 0.05, **p<0.01.
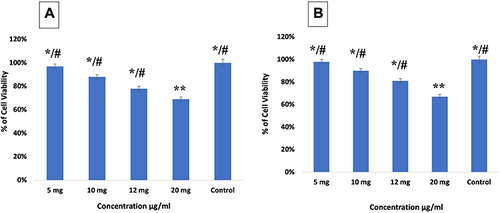
Figure 9 Comparative analysis of antitumor activity of AgNPs and crude extract. Data are expressed as the mean ± SD. */#p< 0.05, **p< 0.01.
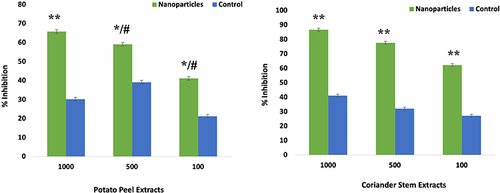
Table 3 Protein Kinase Inhibition Potential of Potato Peels, Coriander Stem and AgNPs
Figure 10 Comparison of α-amylase inhibition of various concentrations of AgNPs and crude extracts. Data are expressed as the mean ± SD.