Figures & data
Scheme 1 Schematic illustration demonstrating the preparation of “nano-neutrophils” (NMPC-NPs) from neutrophil membrane and their synergistic therapeutic efficacy based on their high drug loading (I), PDT-amplified tumor targeting (II) and -accelerated specific release of PTX (III).
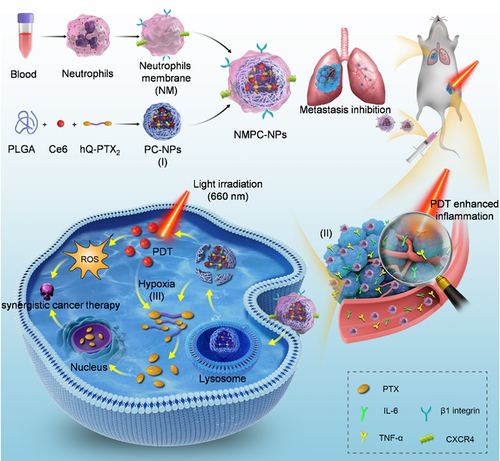
Figure 1 Hypoxia-induced hQ-PTX2 degradation and PTX release. (A) Degradation mechanism of hQ-PTX2. HPLC (B) and LC-MS (C) analysis of hQ-PTX2 degradation upon incubation with Na2S2O4 (10 mM). (D) The PTX release profiles of hQ-PTX2 with or without Na2S2O4 (n = 3).
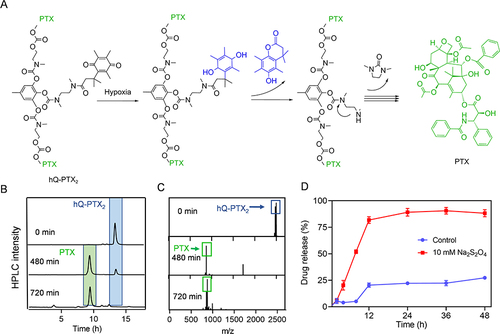
Figure 2 NPs Characterization and PDT-elicited PTX release in vitro and in vivo. (A) Particle size and zeta potential of PC-NPs and NMPC-NPs (n = 3). (B) Representative TEM image of NMPC-NPs. (C) SDS-PAGE image of NEs, NM, NM-NPs. (D) Western blot analysis demonstrating the characteristic protein band of NEs, NM and NM-NPs. (E) The PTX level in cells after incubation with NMPC-NPs for 4 h. Cells were further irradiated and incubated for different times before HPLC analysis (n = 3). (F) Immunofluorescence staining images of tumor sections. Tumors were intratumorally injected with NMPC-NPs, irradiated at 1 h post-injection, and stained with pimonidazole. (G) The PTX level in 4T1 tumors at 3 h, 6 h, and 9 h post-irradiation. Tumors were treated with NMPC-NPs as described in (F) (n = 3). Data expressed as means ± SD. **p < 0.01.
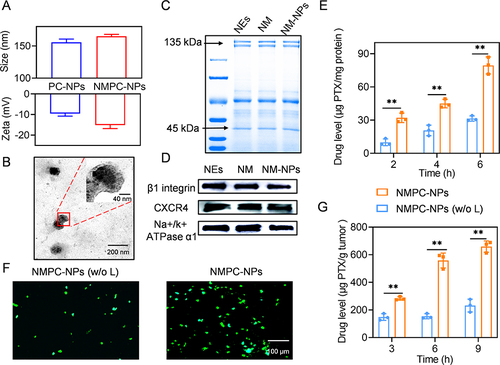
Figure 3 PDT-elicited inflammatory response assisted tumor targeting in vitro. (A) Schematic illustration of cellular uptake assay. 4T1 cells were incubated with NMC-NPs for 12 h, followed by irradiation and incubation for another 12 h. The supernatant of 4T1 cells was added to RAW 264.7 cells, and further cultured overnight to obtain inflammatory medium. 4T1 cells were treated with various NPs with or without inflammatory condition. The expression level of TNF-α (B) and IL-6 (C) from RAW 264.7 cells (n = 3). RAW 264.7 cells were treated as described in (A). (D) CLSM images of 4T1 cells following incubation with C-NPs and NMC-NPs for 4 h. 4T1 cells were pretreated with inflammatory medium for 12 h. (E) The uptake level of NPs in 4T1 cells as evaluated by flow cytometry. 4T1 cells were treated as described in (D). (F) Uptake levels of NPs in 4T1 cells. 4T1 cells were pretreated as described in (D) and further incubated with NPs for different times (n = 3). Data expressed as means ± SD. ***p < 0.001.
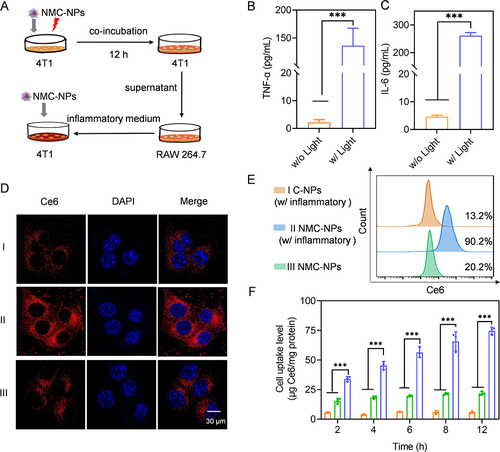
Figure 4 Synergistic anticancer efficacy in vitro. 4T1 cells were incubated with NMC-NPs, PC-NPs, NMPC-NPs for 24 h, followed by irradiation and incubation for 48 h. Cells incubated with NMP-NPs for 72 h served as control. (A) Cytotoxicity of various NPs in 4T1 cells (n = 3). (B) Cytotoxicity of NMP-NPs under hypoxia or normoxia (n = 3). (C) Cytotoxicity of NMPC-NPs with or without VC pretreatment (n = 3). (D) Fluorescence images of 4T1 cells treated with various NPs and stained with calcein-AM and PI. (E) Flow cytometric analysis of 4T1 cells treated with various NPs and stained with Annexin V-FITC/PI.
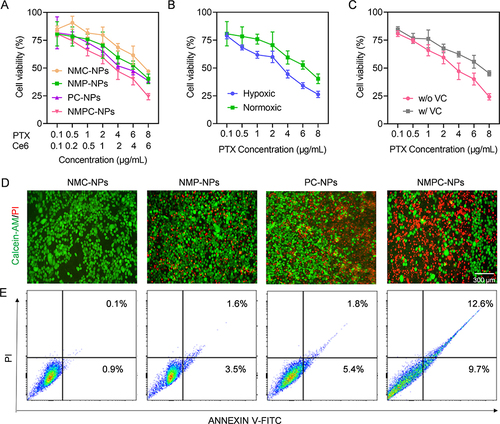
Figure 5 Self-amplified tumor targeting in vivo. Mice were i.v. injected with various groups, irradiated at 8 h post-injection and further received the second administration at 96 h (5 mg Ce6/kg). (A) The time line of tumor accumulation study. (B) Fluorescence images of mice at different time points. Ex vivo fluorescence images (C) and fluorescence intensity (D) of major tissues and tumors harvested at 104 h (n = 3) (H: heart, Li: liver, (S) spleen, Lu: lung, (K) kidney, (T) tumor). (E) Fluorescence images of tumor sections collected at 104 h. TNF-α (F) and IL-6 (G) level in tumors harvested at 104 h (n = 3). Data expressed as means ± SD. ***p < 0.001.
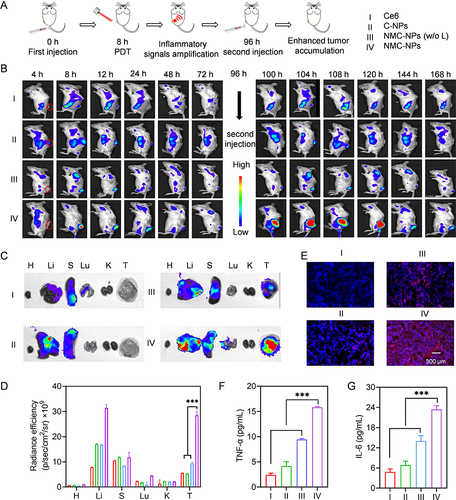
Figure 6 PDT-assisted synergistic anticancer efficacy in vivo. (A) Time line of in vivo antitumor study. Mice were i.v. injected with various groups on day 1, 5, 9, and 13, wherein NMC-NPs, PC-NPs, NMPC-NPs treated mice were irradiated at 8 h post-injection (12.5 mg PTX/kg, 5 mg Ce6/kg). (B) Images of tumors collected on day 26. (C) Tumor volume curves of mice in different groups (n = 8). (D) The tumor growth inhibition rate of various groups (n = 8). (E) Survival rate of mice within 60-d observation period (n = 7). (F) H&E and TUNEL stained tumors harvested on day 26. Data expressed as means ± SD. ***p < 0.001.
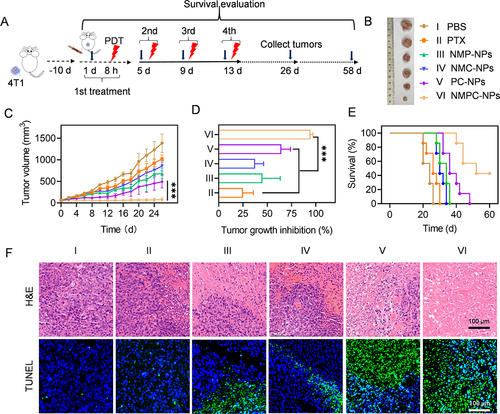
Figure 7 In vivo safety. (A-D) The hematological assessment of mice at day 2 after i.v. injection of PBS or NMPC-NPs (12.5 mg PTX/kg) (n = 3).
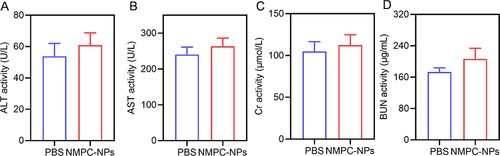
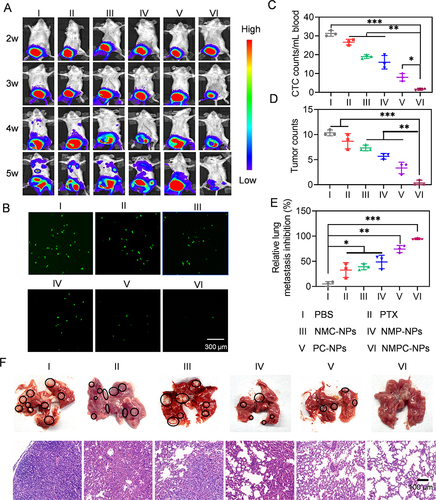
Figure 8 In vivo anti-metastasis efficacy. Mice were i.v. injected with various groups on day 14, 18, 22 and 26, wherein NMC-NPs, PC-NPs, NMPC-NPs treated mice were irradiated at 8 h post-injection (12.5 mg PTX/kg, 5 mg Ce6/kg). (A) Representative bioluminescence images of 4T1 orthotopic mammary tumor-bearing mice in various groups (n = 8). (B) Fluorescence images and number (C) of CTCs (GFP+ 4T1 cells) in the mouse blood isolated on day 36 (n = 3). (D) The number of metastatic nodules in lung harvested on day 36 (n = 3). (E) The inhibition rate of lung metastases in mice (n = 3). (F) The photograph and H&E staining of lung harvested on day 36. Data expressed as means ± SD. *p < 0.05; **p < 0.01; ***p < 0.001.