Figures & data
Figure 1 Schematic illustration of the green synthesis of silver nanoparticles (Ag NPs) using aqueous extract of the Pulicaria glutinosa plant.
Abbreviations: Aq soln, aqueous solution; t, time; T, temperature.
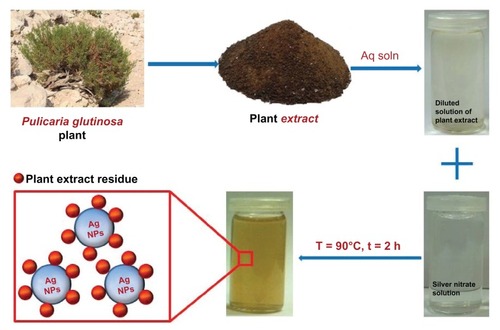
Figure 2 Digital photograph of the aqueous solutions of (A) silver nitrate (AgNO3) without addition of the plant extract, (B) AgNO3 with the addition of the plant extract, and photograph of (C) the pure plant extract at a concentration of 0.1 g/mL. Images (A and B) were recorded after 72 hours.
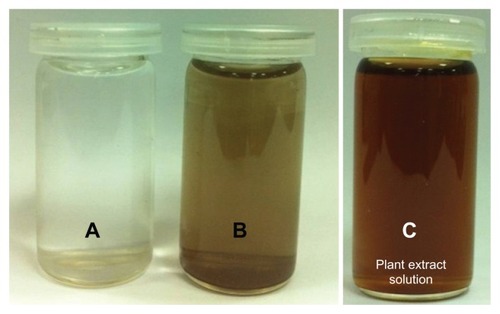
Figure 3 Ultraviolet–visible (UV-Vis) absorption spectra (A and B) and visual appearance of the silver nanoparticle (Ag NP) solution (C). (A) Comparison between UV-Vis spectra of Ag NPs prepared at room temperature (RT) and at 90°C. (B) Plot of the absorption wavelength of Ag NPs at different temperatures. (C) Color change of the solution at 90°C. The samples shown in (C) were obtained during the reaction and photographs recorded before final workup.
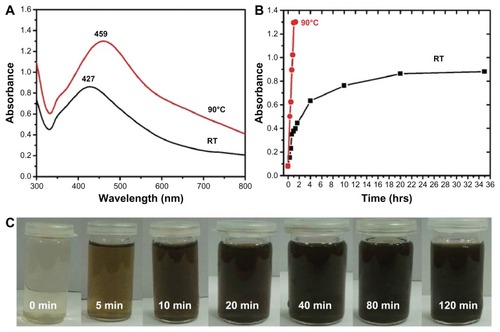
Figure 4 Ultraviolet–visible absorption spectra of silver nanoparticles (Ag NPs) prepared at (A) 90°C using 1 mmol of silver nitrate and 7.5 mL of plant extract and (B) at room temperature using 1 mmol of silver nitrate and 7.5 mL of plant extract.
Note: All spectra were obtained by taking 1 mL of the sample at regular intervals and further diluting it with 9 mL of water then sonicating for 15 minutes.
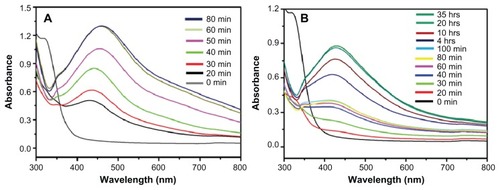
Figure 5 Ultraviolet–visible absorption spectra of silver nanoparticles (Ag NPs) prepared at 90°C for 2 hours using (A) various concentrations of plant extract and keeping the amount of silver nitrate (AgNO3) constant at 1 mmol and (B) various concentrations of AgNO3 and keeping the amount of plant extract constant at 7.5 mL. (C) The diluted solutions of pure Ag NPs (obtained after final workup).
Note: All spectra were measured using same solution concentrations.
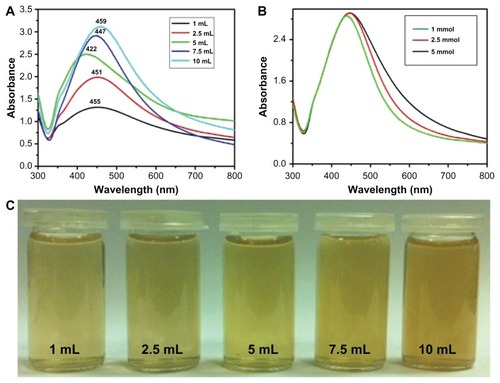
Figure 6 X-ray powder diffraction pattern of the green synthesized silver nanoparticles.
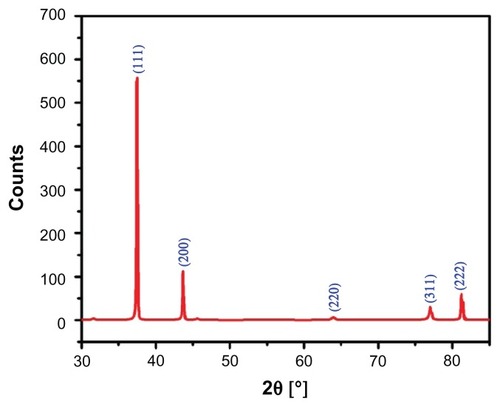
Figure 7 (A–C) Transmission electron microscope images of the green synthesized silver nanoparticles (Ag NPsat different scales. (D) Overview of the size range and distribution of the Ag NPs.
Note: With increasing concentration, less agglomeration was observed.
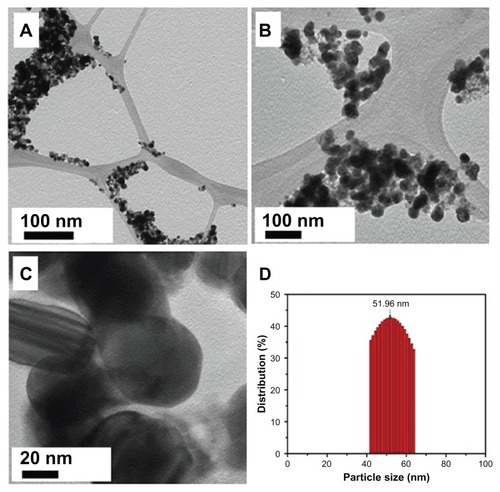
Figure 8 Energy-dispersive X-ray spectrum of green synthesized silver nanoparticles.
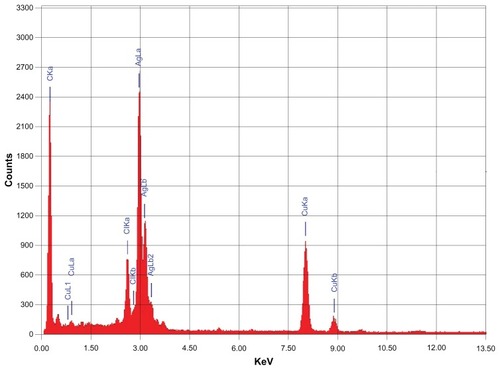
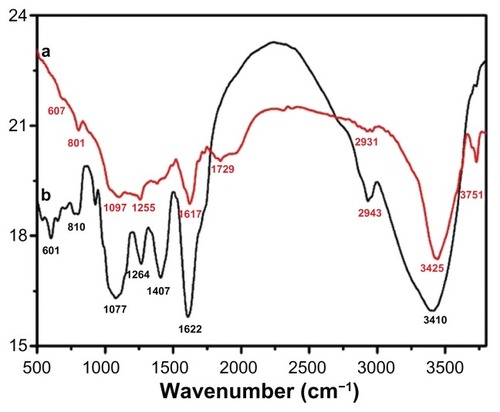
Figure 9 Fourier-transform infrared spectra of pure green synthesized silver nanoparticles (Ag NPs) (line a) and Pulicaria glutinosa plant extract (line b).
Note: The similarities between the spectra strongly suggest the presence of plant extract residue in the Ag NPs as a capping or stabilizing agent.