Figures & data
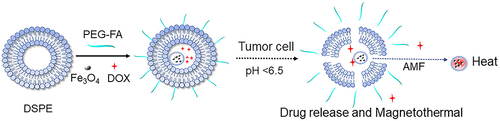
Scheme 1 Illustration of the synthesis and dual-responsive chemo/magnetothermal synergistic therapy mechanism of DP@ Fe3O4 @DOX-FA system. In vivo stealth nanocarriers were created by attaching PEG chains to folate-modified DSPE-PEOz nanomicelles. After loading nanomicelles with magnetic iron particles and DOX, DP@Fe3O4@DOX-FA was synthesized. EPR and folic acid target magnetic nanocarriers to tumor tissues’ acidic environment. The PEG layer is shed, and the micelles release the drug-carrying nanoparticles, finishing the first pH response and boosting tumor cell nanomedicine uptake. The second response occurs when magnetic Fe3O4 nanoparticles enter tumor cells and meet the magnetothermal effect caused by an external magnetic field. Magnetic hyperthermia directly kills tumor cells and enhances chemotherapeutic intake.
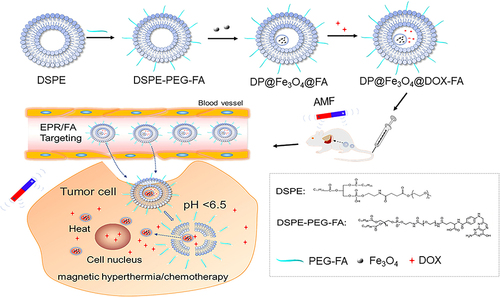
Figure 1 Nanoparticle size and morphology measurements. TEM images of Fe3O4 (a), DP@Fe3O4,@DOX-FA (b) at pH 7.2 and DP@Fe3O4,@DOX-FA (c) at pH 6.0. Hydrodynamic particle sizes measurement of Fe3O4 (d) and DP@Fe3O4,@DOX-FA (e). (d) and (e) were created using OriginPro 2019b software (OriginLab Corporation, Northampton, MA, USA).
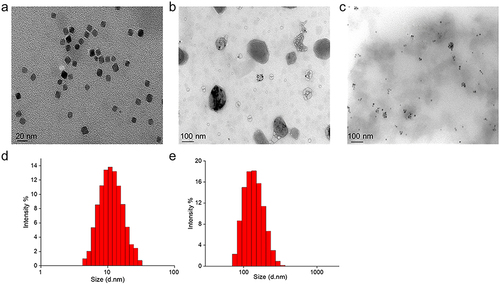
Figure 2 FTIR analysis of Fe3O4@OA, DP@Fe3O4@DOX-FA and DOX. In Fe3O4@OA, O-H and NH stretching vibrations may cause the broad band at 3425 cm−1 and the Fe-O group band at 586 cm−1. The amino group’s 3528 cm-1 vibration disappears in DOX’s IR spectrum, showing the group’s reaction. DOX’s hydroxyl group on the benzene ring vibrates at 3324 cm-1. DP@Fe3O4@DOX-FA preserves the carbonyl group at 1729 cm-1. IR of DP@Fe3O4@DOX-FA shows the stretching in the aromatic ring of FA at 1465 cm-1, the C-O group in the PEG at 1114 cm-1, vibration of amide bond at 1639 cm-1, indicating amidation reaction, and the wide band at 3361 cm-1 corresponding to the OH acid groups on the FA ring. DSPE’s aliphatic structure has C-H stretching bands at 2918 cm-1. The graph were generated by OriginPro 2019b.
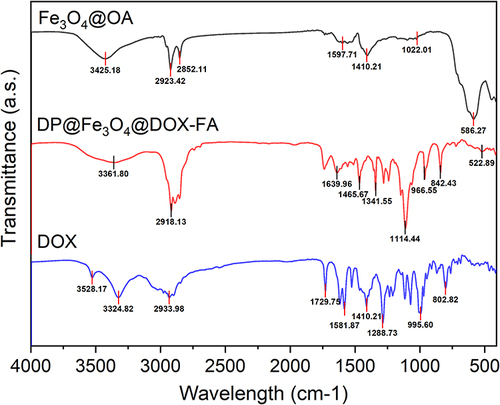
Figure 3 Measurement of Drug loading capacity and Encapsulation efficiency of DP@Fe3O4@DOX-FA. (a) UV absorbance values of three DOX standard solutions and DP@Fe3O4@DOX-FA. (b) UV absorption curves of different concentrations of DOX added to the nanomicelles and DOX encapsulated in the nanomicelles. Graphing was undertaken in OriginPro 2019b.
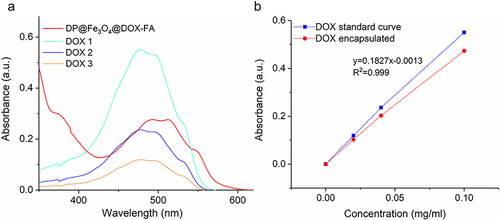
Figure 4 Drug release patterns of the nanomicelles under different stimuli. OriginPro 2019b software was used to plot the results.
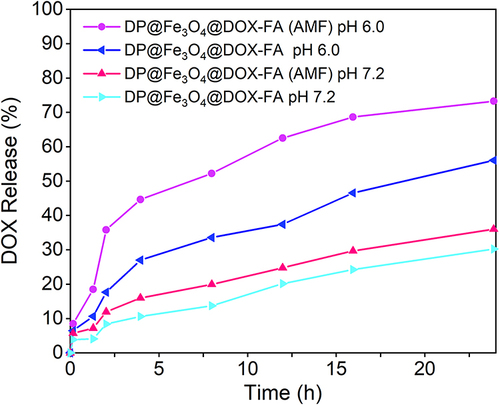
Figure 5 Cytofluorescence assay. Cellular targeting and uptake of DP@Fe3O4@DOX-FA and DOX were examined by CLSM (a) and flow cytometry (b).
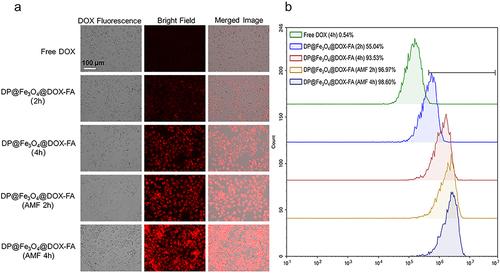
Figure 6 Statistical chart of cytotoxicity experiments. (a) Toxicity analysis of DP@Fe3O4-FA without DOX loading to tumor cells (b) Tumor cell killing research using free DOX and DP@Fe3O4@DOX-FA with or without the AMF. *p < 0.05. Graphs were created using OriginPro 2019b software.
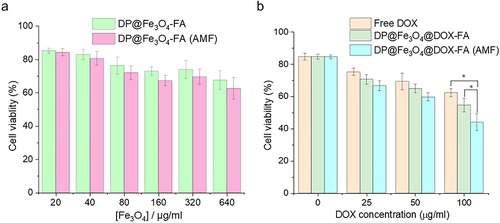
Figure 7 MRI imaging of tumors with DP@Fe3O4@DOX-FA with or without the AMF.
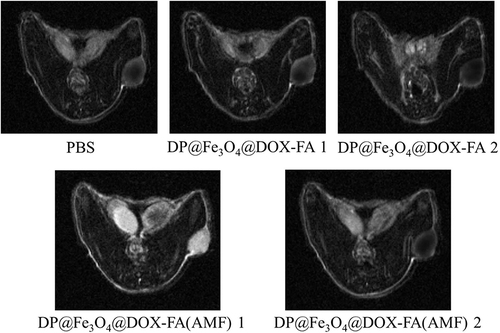
Figure 8 In vivo targeting and drug uptake. (a) Distribution of free DOX and the nanomicelles with or without the AMF after injection into mice. (b) Histogram of fluorescence intensity statistics (created using OriginPro 2019b software).
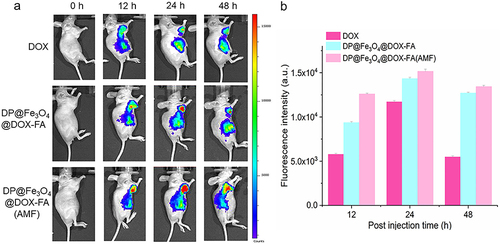
Figure 9 Antitumor effectiveness in vivo. (a) The tumor tissue images of mice after 20 days of therapy (b) Tumor weight statistics (c) Alterations in tumor volume throughout treatment. (b) and (c) were created using OriginPro 2019b software. *p < 0.05, **p < 0.01.
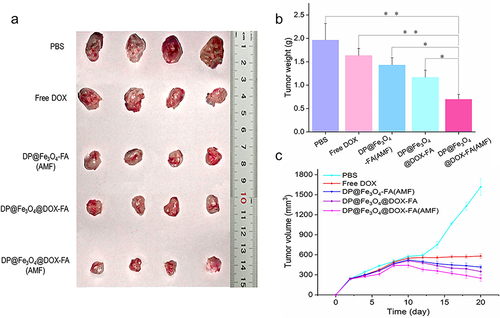
Figure 10 HE-stained images (a) Tumor tissues after different treatments. (b) Assess the toxicity of DP@Fe3O4@DOX-FA with the AMF to the major organs.
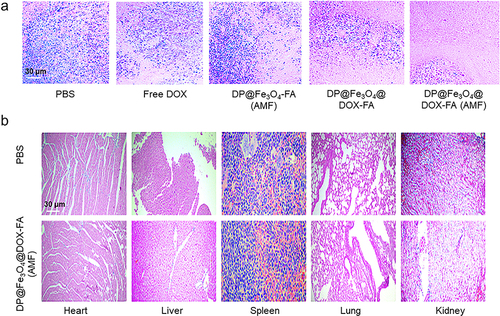
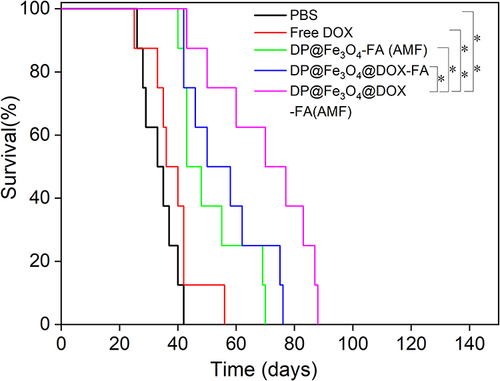
Figure 11 Survival analysis of mice in each group (created using OriginPro 2019b software). *p < 0.05, **p < 0.01.