
Figures & data
Figure 1 Growth curves of S. mutans by different concentrations of AgBr-NP@CTMAB.
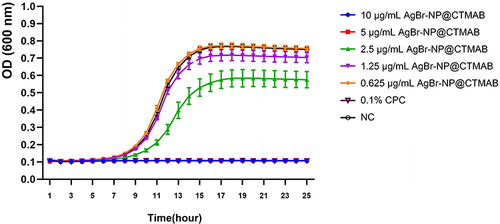
Figure 2 Photographs of the zone of inhibition against S.mutans by AgBr-NP@CTMAB.
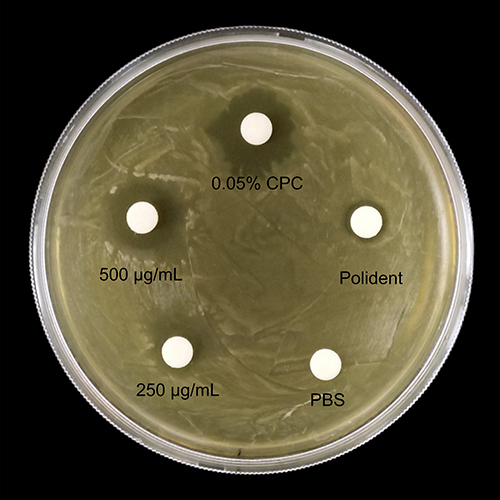
Figure 3 OD results of each group of solutions at 600 nm after 24 h incubation. (ns, P>0.05, ****P<0.0001).
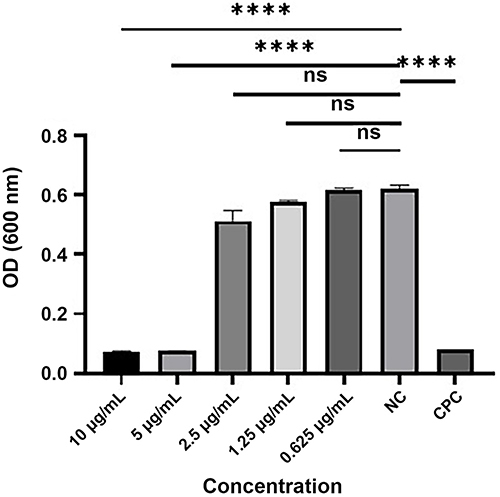
Figure 4 Turbidity of the solution in each group after 24 h incubation.
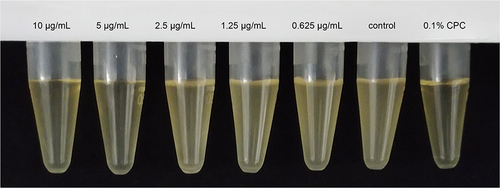
Figure 5 Colony growth after 48 hours of BHI Agar plate culture in different solution groups. (A) The result of the original solution coated plate. (B) The result of the plate coated after dilution of 10,0000 times.
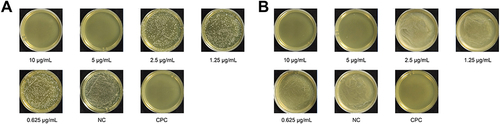
Figure 6 Results of crystalline violet staining for the effect of different solutions on biofilm formation of S. mutans.
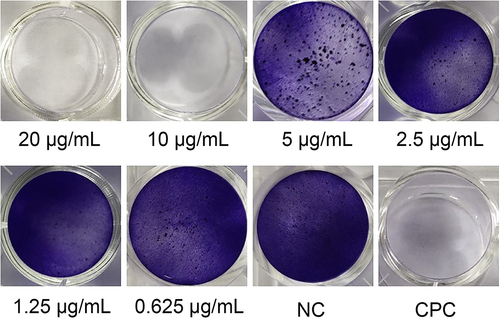
Figure 7 The OD570 nm results of 95% ethanol decolorization after crystal violet staining in each group. (ns, P>0.05, *P<0.05, ***P<0.001, ****P<0.0001).
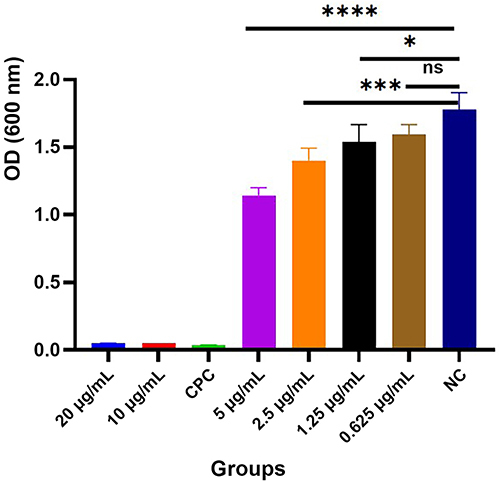
Figure 8 (A) Observation of germicidal efficacy of different solutions under laser confocal microscope. (Overall magnification 100x, scale 200 μm). (B) The percentage of living and dead bacteria within each solution biofilm’s biovolume. (ns, P>0.05, **P<0.01, ***P<0.001).
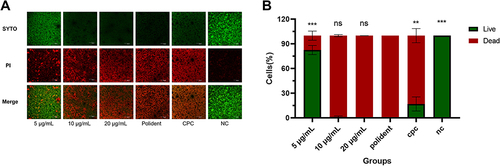
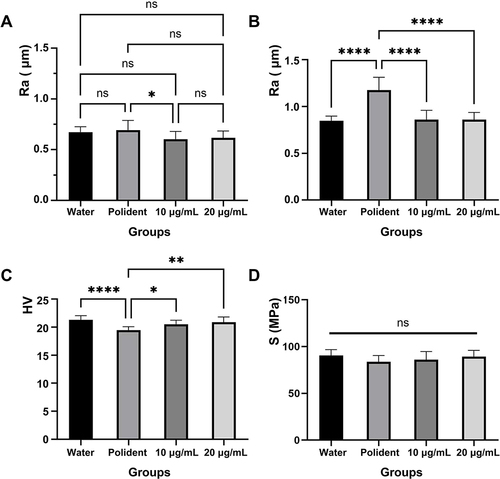
Figure 9 Mechanical properties of PMMA resin such as Surface roughness before immersion treatment (A) and Surface roughness (B), microhardness (C) and flexural strength value (D) were measured after water, as well as Polident and AgBr-NP@CTMAB (10 µg/mL and 20 µg/mL) immersion treatment. The data are presented as the means ± SD. Error bars show the standard deviation (SD) (ns, P>0.05, *P<0.05, **P<0.01, ****P<0.0001, n=10).
Data Sharing Statement
This article has all the data that were created or evaluated during this investigation.