Figures & data
Figure 1 Synthesis of chitosan-g-polyethylene glycol (PEG)-trans-activated transcription (TAT) polymer.
Abbreviation: NHS, N-Hydroxysuccinimide.
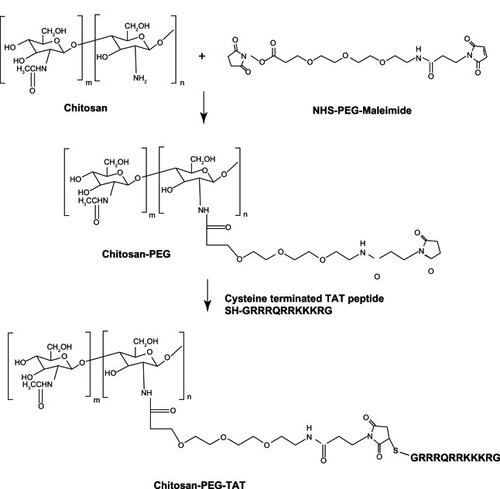
Figure 2 Effect of different pH conditions on the size of chitosan-polyethylene glycol (PEG) nanoparticles, formed using a low molecular weight PEG.
Notes: Data presented are mean ± standard deviation, n = 3 (***P < 0.001). The blue line indicates polydispersity index.
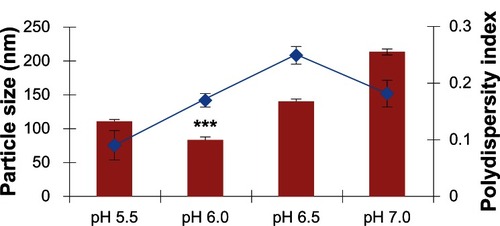
Figure 3 The nanoparticle size and polydispersity index of different nanoparticle formulations, formed at pH 6.0 using high-molecular-weight polyethylene glycol (PEG) and with different ratios of trans-activated transcription (TAT) peptide.
Notes: Data shown are mean ± standard deviation, n = 3 (*P < 0.05, ***P < 0.001). The blue line indicates, polydispersity index.
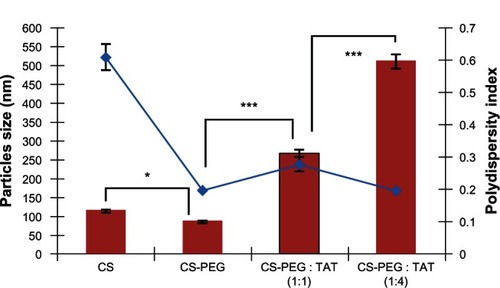
Figure 4 Effect of polyethylene glycol (PEG) molecular weight on the size of chitosan-PEG-trans-activated transcription (TAT) nanoparticles, formed at different pH conditions.
Notes: Data presented are mean ± standard deviation, n = 3 (**P < 0.01).
Abbreviations: LMW, low molecular weight; HMW, high molecular weight.
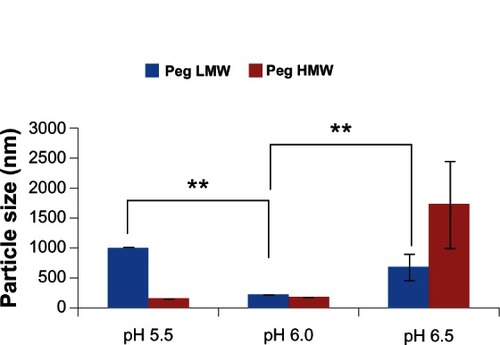
Figure 5 Transfection efficiency of chitosan-polyethylene glycol (PEG)-trans-activated transcription nanoparticles formed with low-molecular-weight (LMW) and high-molecular-weight (HMW) PEG, for the delivery of siGLO Green Transfection Indicator (Thermo Fisher Scientific, Waltham, MA, USA) to mouse neuroblastoma (Neuro2a) cells. Results were analyzed after 4 hours of incubation with various nanoparticle formulations developed at various conditions: (A) LMW PEG at pH 5.5, particle size 1010 nm ± 4.58; (B) HMW PEG at pH 5.5, particle size 143 nm ± 7.51; (C) LMW PEG at pH 6.0, particle size 234 nm ± 4.05; (D) HMW PEG at pH 6.0, particle size 185 nm ± 4.85; (E) LMW PEG at pH 6.5, particle size 691 nm ± 214; (F) HMW PEG at pH 6.5, particle size 1730 nm ± 719.
Note: Scale: 20 μm; magnification 400×.
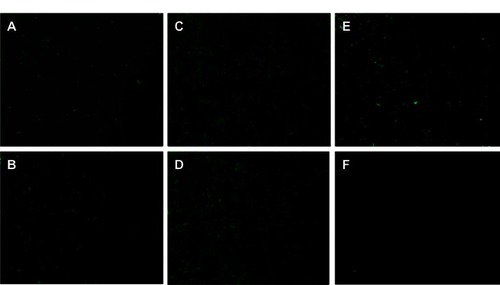
Figure 6 (A) Transfection efficiency performed on mouse neuroblastoma (Neuro2a) cells with chitosan (CS)-polyethylene glycol (PEG)-trans-activated transcription (TAT) nanoparticles, formed at various pH conditions, with high- and low-molecular-weight PEG. (B) Cytotoxicity of unmodified and modified CS nanoparticle formulations evaluated on Neuro2a cells using 3-(4,5-dimethylthiazol-2-yl)-5-(3-carboxymethoxyphenyl)-2-(4-sulfophenyl)-2H-tetrazolium (MTS) assay at 490 nm.
Notes: Data shown are mean ± standard deviation, n = 3 (*P < 0.05, **P < 0.01, ***P < 0.001).
Abbreviations: HMW, high molecular weight; LMW, low molecular weight.
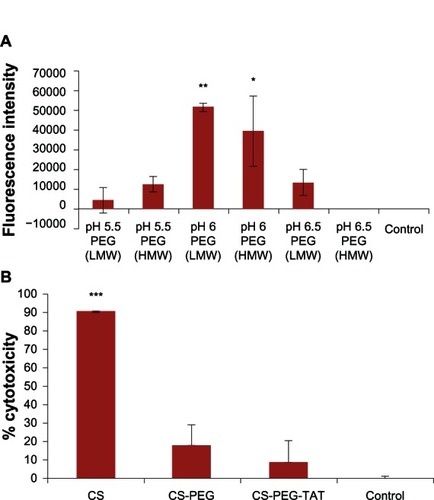
Table 1 Zeta potential of various nanoparticle formulations
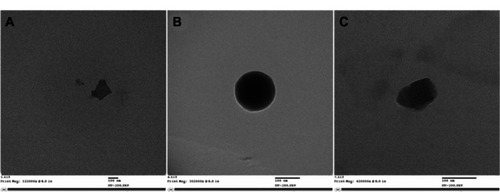
Figure 7 Transmission electron microscope images of (A) unmodified chitosan nanoparticles (magnification 122,000×), (B) polyethylene glycol (PEG)ylated chitosan nanoparticles (magnification 302,000×), and (C) trans-activated transcription-tagged PEGylated chitosan nanoparticles (magnification 420,000×) formed at pH 6.0, with low-molecular-weight PEG.
Note: Scale bars = 100 nm.