Figures & data
Figure 1 Agarose gel electrophoresis of pVAX1-HIV gag and pVAX1 vectors.
Notes: The empty pVAX1 vector was 3000 bp. After insertion of HIV gag fragment (1500 bp), the pVAX1-HIV gag was 4500 bp.
Abbreviation: bp, base pair; HIV, human immunodeficiency virus.
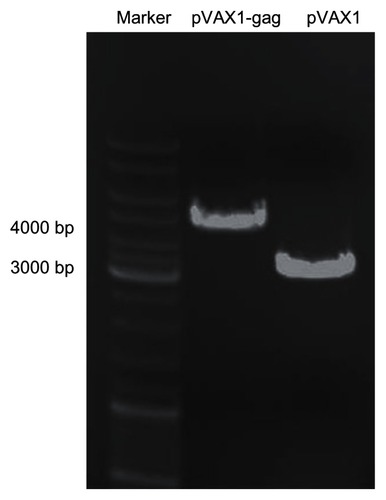
Figure 2 In vitro transcription activity of man-PEI and PEI 25k on DC 2.4 cells. (A) Quantified by β-galactosidase assay using plasmid encoding lacZ as a reporter gene. (B) Transfected with pVAX1-HIV gag and quantified by the transcription level of HIV gag gene using real-time PCR.
Notes: The β-galactosidase activity of the m-PEI/DNA group was significantly higher than that of the naked DNA group and the PEI 25k/DNA group, ***P < 0.005. The PEI 25k/DNA group was higher than the naked DNA group, *P < 0.05.
Abbreviations: man-PEI, mannosylated polyethyleneimine; PEI 25k/DNA, polyethyleneimine 25k and DNA plasmid complex; DC, dendritic cells; DNA, deoxyribonucleic acid; m-PEI/DNA, mannosylated polyethyleneimine and DNA plasmid complex; glu, glucose; HIV, human immunodeficiency virus; PCR, polymerase chain reaction.
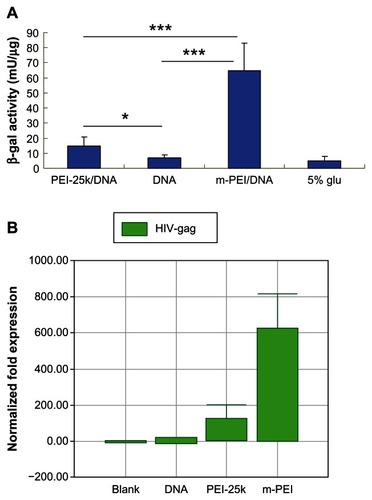
Figure 3 Specific antibody titer (IgG, IgG1, IgG2a) of HIV-gag.
Notes: The titer of the 5% glucose group was used as a background level. Blood samples were diluted by twofold dilution from 1:16. The data were represented as the mean ± standard deviation of three independent experiments. The IgG2a titer of the m-PEI/DNA group was significantly higher than the naked DNA group and Mock, *P < 0.05. The IgG and IgG1 titer of the three groups were nonsignificant.
Abbreviations: Ig, immunoglobulin; HIV, human immunodeficiency virus; DNA, deoxyribonucleic acid; Mock, empty vector pVAX1; m-PEI/DNA, mannosylated polyethyleneimine and DNA plasmid complex.
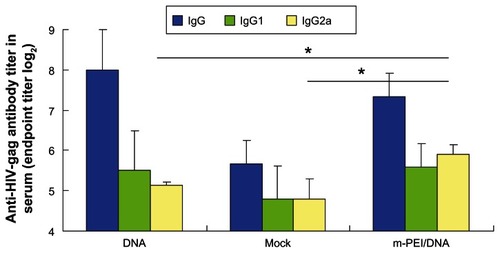
Figure 4 Intracellular cytokine staining of splenocytes after AdV boosting immunization. (A) The CD8+/IFN-γ+ staining. (B) The CD4+/IL-4+ staining results. (C and D) The double-positive percentage of CD8+/IFN-γ+ and CD4+/IL-4+.
Notes: The data were represented as mean ± standard deviation of three independent experiments. The double-positive percentage of CD4+/IL-4+ and CD8+/IFN-γ+ of the m-PEI/DNA group was significantly higher than that of the naked DNA group and Mock, *P < 0.05; ***P < 0.005.
Abbreviations: AdV, adenovirus; IFN, interferon; PE, polyethyleneimine; DNA, deoxyribonucleic acid; m-PEI/DNA, group primed with a complex of mannosylated polyethyleneimine and DNA plasmid and boosted with AdV; Mock, group primed with empty vector pVAX1 and boosted with AdV; FITC, fluorescein isothiocyanate; IL, interleukin.
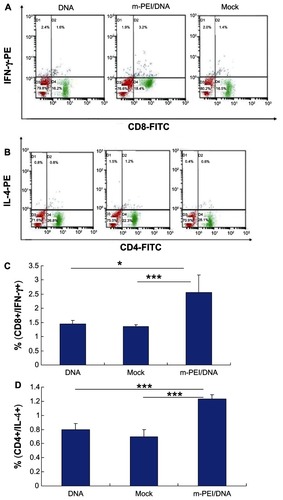
Figure 5 The cytokine production of mice immunized with DNA and AdV. (A and C) The IFN-γ and IL-4 production in serum, respectively. (B and D) The IFN-γ and IL-4 production in splenocytes culture supernatant, respectively.
Notes: The data were represented as mean ± standard deviation of three independent experiments. The IFN-γ and IL-4 levels in blood serum and the splenocytes culture supernatant of the m-PEI/DNA group were significantly higher than that of the naked DNA/AdV group and Mock. The serum IFN-γ level of the DNA group was higher than that of the Mock group, *P < 0.05; ***P < 0.005.
Abbreviations: DNA, deoxyribonucleic acid; IFN, interferon; Mock, group primed with empty vector pVAX1 and boosted with AdV; m-PEI/DNA, group primed with a complex of mannosylated polyethyleneimine and DNA plasmid and boosted with AdV; glu, glucose; IL, interleukin; AdV, adenovirus.
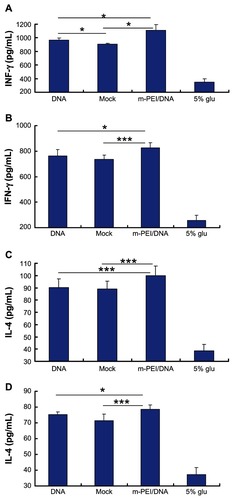
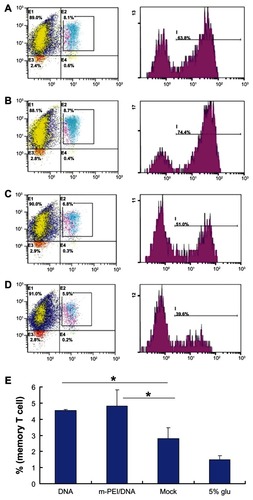
Figure 6 Memory T-cell assay results. (A) The flow cytometry result of the DNA group. (B) The result of the m-PEI/DNA group. (C) The result of the Mock group. (D) The result of 5% glucose. (E) The frequency of triple-positive cells, *P < 0.05.
Note: The triple-positive percentage of the m-PEI/DNA group and the DNA group were higher than Mock, *P < 0.05.
Abbreviations: DNA, deoxyribonucleic acid; m-PEI/DNA, group primed with complex of mannosylated polyethyleneimine and DNA plasmid and boosted with AdV; Mock, group primed with empty vector pVAX1 and boosted with AdV; glu, glucose; AdV, adenovirus.