
Figures & data
Figure 1 The sensing mechanism of the GO-SPR biosensor to measure PAPP-A and PAPP-A2. (A) The real picture of a GO-based SPR chip. (B) A schematic diagram of the GO-SPR biosensor. The 1 mg/mL GO sheet (1.8 nm) is immobilized on the Au film (47 nm) surface. (C) The interactions between GO functional groups and protein molecules. The surface of the GO sheets is rich in oxidizing functional groups which enhance the bio-affinity.
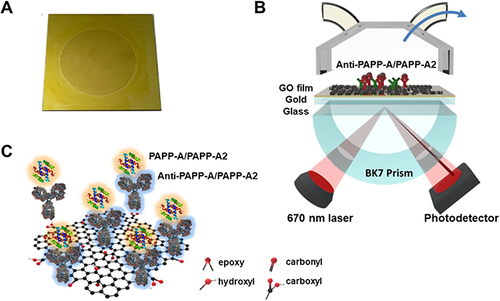
Figure 2 Microscopic morphology and chemical structure of GO sheets. (A and B) High-resolution TEM images of a GO sheet with a layer-by-layer lamination and organic shell matrix structure. In , the TEM image features a 50 nm ruler scale, and the observed stacked and wrinkled flakes suggest that most GO sheets have a diameter of less than 50 nm. (C) The graph of SPR characteristic curves between bare Au chips and GO-based chips, which was generated using the OriginPro 9.1 software. The SPR angular displacements of bare Au and GO-based chips are 34.96° and 35.18°, respectively. (D) The UV-Vis absorption spectrum and chemical structure of GO sheets. An absorption peak at around 230 nm represents the π–π* absorption peak of aromatic C-C bonds in different aromatic sp2 cluster sizes, and a weak shoulder at around 300 nm represents the n–π* absorption peak because of epoxy and carbonyl bonds.
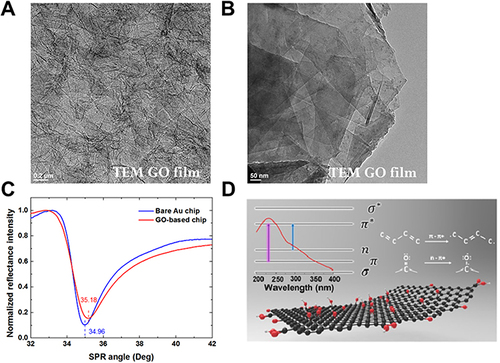
Figure 3 SPR angle shifts of PAPP-A and PAPP-A2 in clinical samples. (A and B) Relationships between SPR angle shifts and values of commercial assays for measuring PAPP-A (r = 0.966) and PAPP-A2 (r = 0.957). (C) SPR angle shifts of PAPP-A and PAPP-A2 in the preeclampsia and normal groups. The SPR angle shift of PAPP-A in the preeclampsia group 5.33 (4.55 mDeg) is significantly smaller than that in the control group 6.89 (4.10 mDeg) (P = 0.008). The SPR angle shift of PAPP-A2 in the preeclampsia group 5.70 (3.81 mDeg) is significantly larger than that in the control group 3.63 (2.38 mDeg) (P < 0.001). (D) SPR angle shifts of PAPP-A and PAPP-A2 in the early- and late-onset preeclampsia groups. PAPP-A2 SPR angle shift in the early-onset preeclampsia group (9.53 ± 16.16 mDeg) is significantly larger than that in the late-onset preeclampsia group (5.60 ± 6.27 mDeg) (P = 0.007).
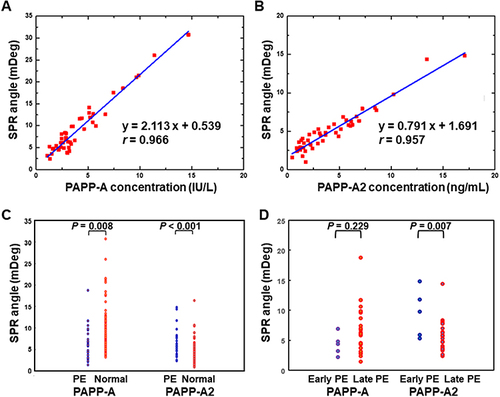
Table 1 Maternal Characteristics, Laboratory Data, and Neonatal Outcomes
Table 2 ROC Curve Analyses of PAPP-A, PAPP-A2, and PAPP-A/PAPP-A2 Ratio for Predicting Preeclampsia
Figure 4 ROC curve analyses of PAPP-A, PAPP-A2, and PAPP-A/PAPP-A2 ratio for predicting preeclampsia: (A) All preeclampsia. The AUCs for PAPP-A, PAPP-A2, and PAPP-A/PAPP-A2 ratio are 0.65, 0.76, and 0.79. (B) Early-onset preeclampsia. The AUCs for PAPP-A, PAPP-A2, and PAPP-A/PAPP-A2 ratio are 0.83, 0.92, and 0.99. (C) Late-onset preeclampsia. The AUCs for PAPP-A, PAPP-A2, and PAPP-A/PAPP-A2 ratio are 0.62, 0.73, and 0.75.
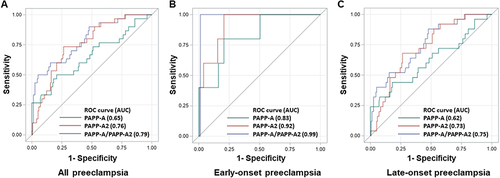
Table 3 ROC Contrast Estimation and Testing Results of PAPP-A, PAPP-A2, and PAPP-A/PAPP-A2 Ratio