Figures & data
Figure 1 TEM, HRTEM, STEM, and mapping images of collagen fibrils treated with BMS. (a) TEM image of Ce-collagen fibrils after incubation for 3 d, revealing high electron density. (b) After 7 d of incubation, mineral deposition within collagen fibrils could be observed. (c) Dense minerals deposited within Ce-collagen fibrils after 14 d. (d) HRTEM image reveals intrafibrillar mineralization after 14 d. (e) The SEAD pattern unravels the mineral form within the Ce-collagen fibrils with 111, 220 and 311 diffraction rings. (f) HRTEM image shows the typical interplanar spacing: 3.19 Å. (g) The STEM image of the mineralized collagen and elemental mapping reveals the even distribution of the elements. The scale bars for each figure are located at the corner of the panels.
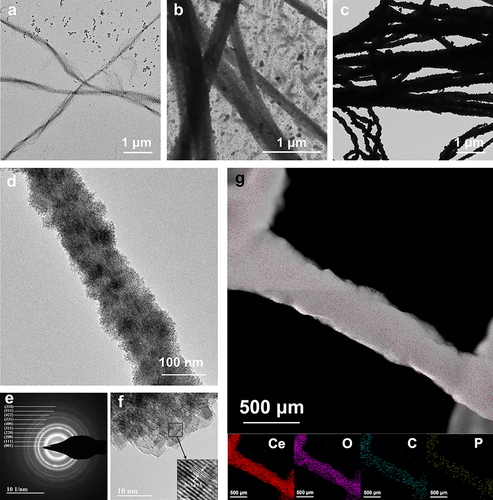
Figure 2 TEM, HRTEM, FTIR and XPS images of collagen membranes treated with BMS. (a) TEM image of pure collagen membranes reveals low electron density, while the inset SAED image shows the amorphous state. (b) Dense minerals were deposited within Ce-collagen fibrils after 14 d, with the SAED pattern unraveling the mineral form within the collagen fibrils (inset). (c) HRTEM image that reveals the crystal spacing of crystals within collagen. (d) FTIR spectra of Ce-collagen membranes after incubation for 14 d demonstrate that the mineralized crystals are identical to cerium oxide. (e) The XPS images of Ce-collagen membranes after incubation for 7 and 14 d. The scale bars are marked in the corner of the panels.
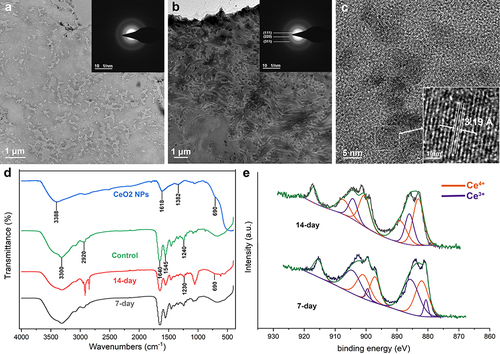
Figure 3 TEM, STEM, mapping, SEM, FTIR, and XPS images of dentin treated with BMS. “Re” marked in the panels represents the remineralized dentin, “De” represents demineralized dentin, and “Id” represents intact dentin. ∆ represents the crystals deposited in dentinal tubules and dentin surfaces. (a) The TEM image shows demineralized dentin resulting from treatment with 17% EDTA. (b and c) The TEM image shows dentin treated with BMS for 7 d (b) and 14 d (c). (d) The STEM image and elemental mapping revealed the even distribution of the elements after the demineralized dentin was treated with 17% EDTA and subsequently incubated after 14 days. (e and f) The SEM images of the surface of remineralized dentin. (g) The ATR-FTIR image demonstrates that the mineralized crystals are identical to cerium oxide. (h) The XPS images of 7- and 14-day remineralized dentin. The scale bars are marked in the corner of the panels.
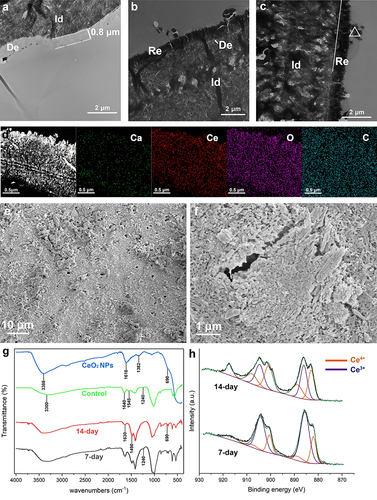
Figure 4 Micro-CT images of root canals treated with EDTA during root canal preparation are presented in (a and b), displaying the longitudinal and cross-sectional sections, respectively. (c and d) show the corresponding images of remineralized root canals. The high-density range of micro-CT images (gray values distributed above 7000) is highlighted in red (e). The density of the remineralized crystal deposit layer on the inner wall of the root canal was higher than natural root canal. (f) High-density mineral deposits can also be observed in the lateral root canals of the teeth. Scale bar: 1 mm.
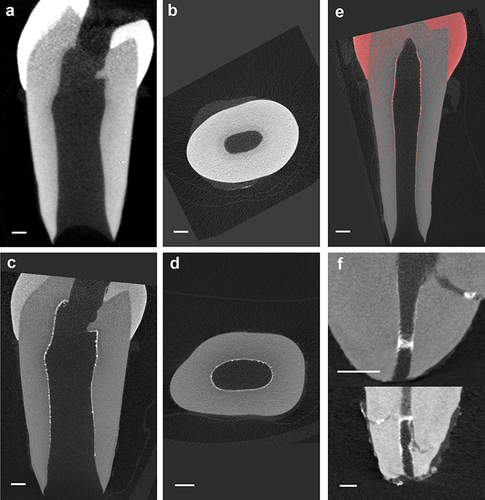
Figure 5 Optical density of bacterial fluid after adding different concentrations of dextran, cerium nitrate or dextran-cerium nitrate. All data are presented as Mean±S.D. **P<0.01 vs the control group; *P<0.05 vs the control group; ns, not significant.
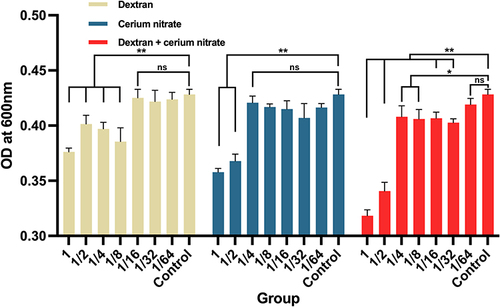
Figure 6 (a) Representative fluorescence micrographs and count of live/dead E. faecalis in the control group and the remineralized dentin group. The green dots correspond to live E. faecalis, and the red dots indicate dead E. faecalis. Scale Bar: 100 μm. (b) The average number of live/dead bacteria in each selected area of the control group and 14-day remineralized group. All data are presented as Mean±S.D. **P<0.01 vs the control group.
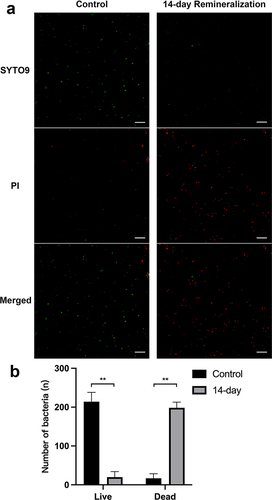
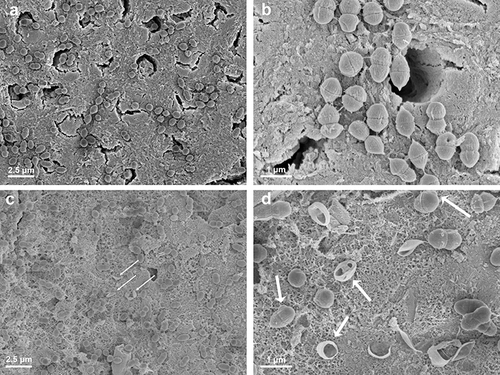
Figure 7 The morphology of Enterococcus faecalis on the surface of untreated dentin (a and b) and remineralized dentin (c and d) was examined using SEM. (a and b) The SEM images depict the approximate number and morphology of E. faecalis on the untreated dentin surface. (c and d) The morphology of E. faecalis on the surface of the remineralized dentin. The white arrows indicate abnormal bulges on the bacterial cell membrane and the ruptured bacterial envelopes.