Figures & data
Figure 1 Isolation and characteristics of ApoEVs. (A) Schematic view of the process of isolating ApoEVs. Briefly, HUVECs were induced by 250 nM STS for 8 h and then the culture medium was sequentially centrifuged to obtain ApoEVs. (B) The morphology of normal and apoptotic HUVECs. Scale bar=200 μm. (C) TUNEL analysis of normal and apoptotic HUVECs. Apoptotic cells were indicated by TUNEL-positive cells (green). Scale bar=100 μm. (D) Flow cytometry analysis of normal and apoptotic HUVECs. (E) Statistic analysis of the percentage of positive cells. (F) NTA analysis of the size distribution of ApoEVs. (G) TEM analysis of the morphology and size of ApoEVs. Scale bar=200 nm. (H) Immunofluorescence staining of ApoEVs. ApoEVs were indicated by an apoptosis-specific surface marker, Ptdser (shown by Annexin V staining, green). (I) Western blotting analysis of cleaved caspase 3, Cav 1, Fas, and β-actin expressed in normal HUVECs, apoptotic HUVECs, and ApoEVs. The significance was tested with an unpaired two-tailed Student’s t-test. (*p<0.05, ****p<0.0001).
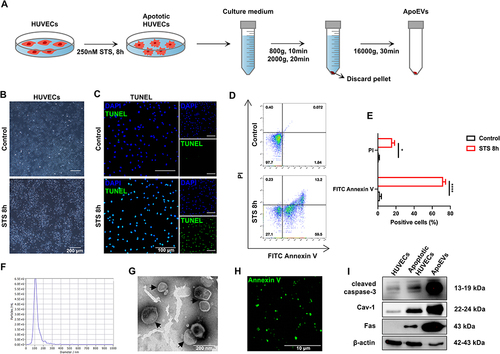
Figure 2 The effect of ApoEVs on the function of HUVECs in vitro. (A) Immunofluorescence staining of Dio-labeled ApoEVs (green) engulfed by HUVECs (red). Scale bar=20 μm. (B and C) CCK-8 analysis of the effect of different concentrations of ApoEVs on the proliferation of HUVECs. (D) Scratch analysis of the effect of different concentrations of ApoEVs on the migration of HUVECs. Scale bar=400 μm. (E) Statistic analysis of migrated area (n=3). (F) Tube formation analysis of the effect of different concentrations of ApoEVs on the angiogenesis of HUVECs. Scale bar=200 μm. (G) Statistic analysis of the number of nodes, number of junctions, and total length. (H) qRT-PCR analysis of the difference between 20 μg/mL and 30 μg/mL ApoEVs on the angiogenic differentiation of HUVECs. The significance was tested with an unpaired two-tailed Student’s t-test. (nsp>0.05, *p<0.05, **p<0.01, ***p<0.001).
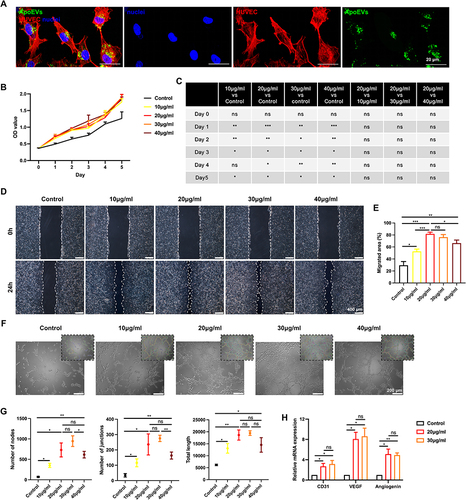
Figure 3 The effect of ApoEVs on the function of HFFs in vitro. (A) Immunofluorescence staining of Dio-labeled ApoEVs (green) engulfed by HFFs (red). Scale bar=20 μm. (B and C) CCK-8 analysis of the effect of different concentrations of ApoEVs on the proliferation of HFFs. (D) Scratch analysis of the effect of different concentrations of ApoEVs on the migration of HFFs. Scale bar=400 μm. (E) Statistic analysis of migrated area (n=3). (F) qRT-PCR analysis of the effect of different concentrations of ApoEVs on the fibrogenic differentiation of HFFs. The significance was tested with an unpaired two-tailed Student’s t-test. (nsp>0.05, *p<0.05, **p<0.01).
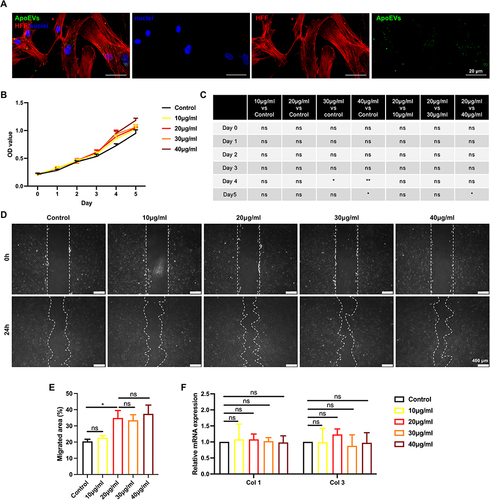
Figure 4 The effect of ApoEVs on wound closure, re-epithelialization, the formation of granulation tissue, and vascularization in vivo. (A) Schematic view of the experimental process in vivo. (B) Digital pictures of wounds on day 0, day 3, day 6, day 9, day 12, and day 16. The inner diameter of the ring=16 mm. (C) Pattern diagrams of wounds at each time point. (D) Statistic analysis of the wound closure rate (n=3). (E) H&E staining of wounds on day 6. The black inverted triangles pointed out the edge of re-epithelialization. The black lines pointed out the area of the regenerated epidermis. Scale bar=200 μm. (F) Statistic analysis of the re-epithelialization rate (n=3). (G) H&E staining and (H) Masson staining of granulation tissue on day 6. The solid lines with stops represented the thickness of granulation tissue. The arrows pointed out the blood vessels. Scale bar (left)=500 μm. Scale bar (right)=200 μm. (I) Statistic analysis of granulation tissue thickness (n=3). (J) Statistic analysis of the number of blood vessels per field of view (scale bar=200 μm, n=3). The significance was tested with an unpaired two-tailed Student’s t-test. (*p<0.05, **p<0.01).
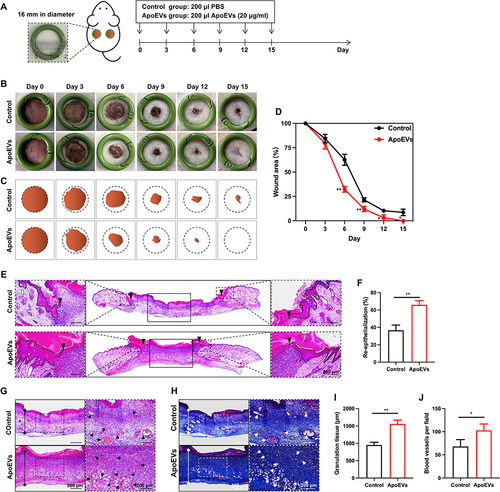
Figure 5 The effect of ApoEVs on scar formation in vivo. (A and B) Digital pictures and pattern diagrams of scars on day 45. The inner diameter of the ring=16 mm. (C) Statistic analysis of the scar area (n=3). (D and E) H&E staining, Masson staining, and immunofluorescence staining (Col 1 and Col 3) of scars on day 45. The dotted line pointed out the edge of the scars. Scale bar=1 mm. (F) Statistic analysis of the percentage of scar length (n=3). (G) Statistic analysis of relative fluorescence density (Col 1/DAPI, Col 3/DAPI, Col 3/Col 1) (n=3). The significance was tested with an unpaired two-tailed Student’s t-test. (nsp>0.05, *p<0.05, **p<0.01).
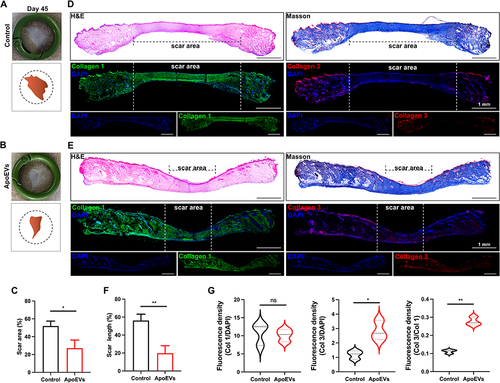
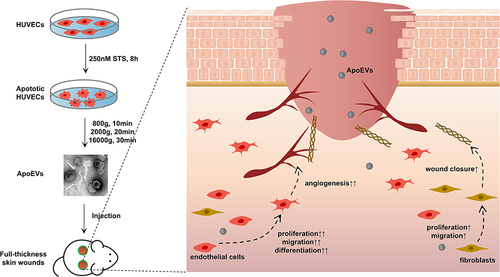
Figure 6 Conclusion. HUVECs-derived ApoEVs promoted skin wound healing.