Figures & data
Figure 1 CPP inhibited cancer cell proliferation. (A) Schematic illustration of the synthesis of CPP-IL-12. (B) Size distribution of CPP. (C) The average zeta potentials of CPP. (D) Transmission Electron Microscope images of CPP. Scale bars=200 nm. (E) The chemical composition was analyzed by Fourier transform infrared spectroscopy. (F) Heating curves of different concentrations of CPP under 808 nm (2 W/cm2) laser irradiation. (G) The photothermal conversion cycling test of CPP during three cycles of laser on/off. The data are presented as the mean ± SD of three independent experiments. (H) Electrophoretic analysis of pEGFP plasmid in the complexes of CPP under various N/P ratios. (I) B16F10 cells incubated with CPP@pEGFP complexes (N/P from 10:1 to 40:1); green colour, EGFP expression. Scale bars=125 μm. (J) Analyzing the cytotoxicity of CPP, ANOVA. (K) ROS detection. CPP treatment increased ROS levels, and 2.0 W/cm2 of laser further increased ROS levels. **P<0.01, ANOVA. (L) Cell proliferation analysis. B16-F10 cell proliferation was suppressed at 3 min to 9 min after laser treatment, **P<0.01, ANOVA.
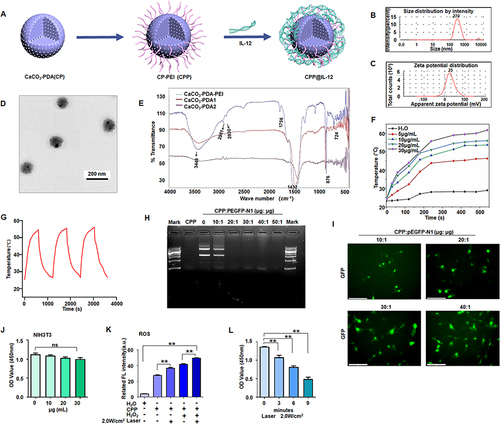
Figure 2 CPP transferred IL-12 into B16F10 cells and CPP-IL-12 induced immunogenic cell death. (A) The structure of IL-12 vector. (B) Western blot detection of IL-12 expression. **P < 0.01, Student’s t-test. (C) ELISA. CPP-IL-12 increased IL-12 levels in the supernatant of B16-F10 cells, and 2.0 W/cm2 of laser further increased IL-12 levels. **P < 0.01, ANOVA. (D) Live/dead staining assay. Scale bars=100 μm. (E) The number of dead cells. CPP-IL-12 increased and 2.0 W/cm2 of laser further increased the number of dead cells. **P < 0.01, ANOVA. (F) Cell apoptosis analysis. CPP-IL-12 increased and laser treatment further increased the number of apoptotic cells. (G) Immunofluorescence. Green color, CALR expression. Scale bars=2 μm. (H, I) ELISA analysis of extracellular and intracellular HMGB1 levels, respectively. *P < 0.05, **P < 0.01, ANOVA. (J) ATP levels. The ATP levels decreased in CPP-IL-12-treated cells, and laser treatment further reduced ATP content. **P < 0.01, ANOVA. (K) CPP increased CD80+/CD86+ expression of DC.

Figure 3 CPP-IL-12 suppressed melanoma cell growth in vivo. (A) Schematic illustration of in vivo study. (B) The xenografts dissected from mice. (C, D) The weights and volumes of xenografts were analyzed. Data were presented as the mean ± SD or median (interquartile range). n=4 or 5, **P < 0.01, *P < 0.05; Student’s t-test or Mann–Whitney U-test. (E) HE staining demonstrated that CPP-IL-12 suppressed and laser further inhibited the growth of tumor xenografts in vivo. (F) The levels of IL-12 in tumor xenografts analyzed by immunohistochemistry staining. The brown signal indicated the expression of IL-12 in the tissue, the blue signal was nuclear of cells. There was more IL-12 expression in CPP-IL-12 treated groups. Scale bars=125 μm.
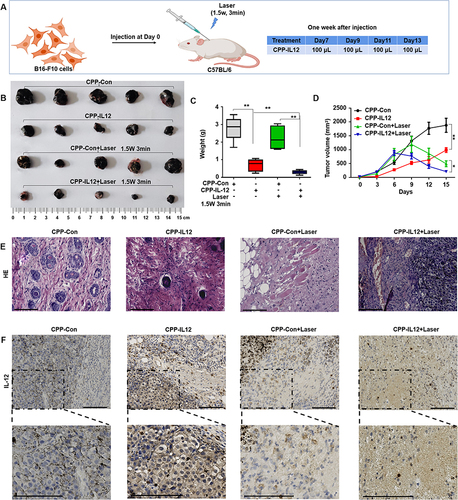
Figure 4 CPP-IL-12 promoted systemic antitumor immunity. (A) Analyzing CALR expression in tissues by immunofluorescence. Green color, CALR expression. Scale bars=20 μm. (B) CPP-IL-12 increased CD80+/CD86+ expression of DC in lymph glands. (C) CPP-IL-12 increased the number of CD3+/CD8+T cells from spleen. (D) CPP-IL-12 increased the number of CD3+/CD4+T cells from spleen.
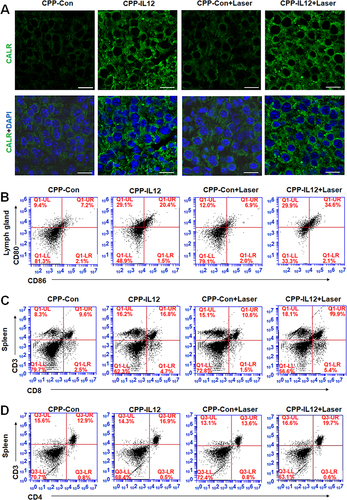
Figure 5 CPP-IL-12 increased the expression of CD4, CD8, granzyme B, IFN-γ and TNF-α. (A) CPP-IL-12 increased IL-12 levels in tumor xenografts. Scale bars =125 μm. (B) The levels of CD8 were increased in tumor xenografts analyzed by immunohistochemistry staining. Scale bars =125 μm. (C) CPP-IL-12 increased CD4 expression in tumor xenografts. Scale bars=125 μm. (D) ELISA analysis showed that Granzyme B levels increased in CPP-IL-12-treated tumor xenografts. **P< 0.01, ANOVA. (E) IFN-γ levels increased in CPP-IL-12-treated tumor xenografts. **P < 0.01, ANOVA. (F) TNF-α levels increased in CPP-IL-12-treated tumor xenografts. **P < 0.01, ANOVA. (G) CPP-IL-12 treatment increased granzyme B levels in mouse serum. **P < 0.01, ANOVA. (H) CPP-IL-12 treatment increased IFN-γ levels in mouse serum. **P < 0.01, ANOVA. (I) CPP-IL-12 treatment increased TNF-α levels in mouse serum. **P < 0.01, ANOVA.
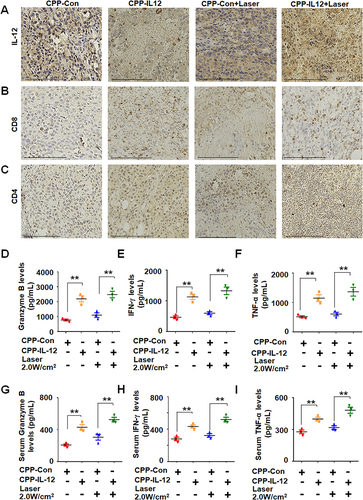
Figure 6 CPP-IL-12 suppressed the growth of local and distant xenografts. (A) Schematic description and the mechanism of the effect of local treatment to tumor on distant untreated one. This image was made by using Figdraw software. (B–D) CPP-IL-12 with laser treatment inhibited the growth, weights and volumes of local xenografts, respectively. **P < 0.01, ANOVA. (E–G) CPP-IL-12 with laser treatment suppressed the growth, weights and volumes of distant tumors, respectively. **P < 0.01, ANOVA. (H–J) ELISA analysis showed that IFN-γ, TNF-α, and granzyme B levels were increased in the serum of CPP-IL-12-treated mice, respectively. **P < 0.01, ANOVA. (K) CD80+/CD86+ expression of DC was increased in the lymph glands of CPP-IL-12-treated mice. (L) CD4 expression of T cells was increased in the spleens of CPP-IL-12-treated mice. (M) CD8 expression was increased in the spleens of CPP-IL-12-treated mice. (N, O) The CD8 and CD4 levels were analyzed by immunohistochemistry staining, respectively. Scale bars=125 μm.
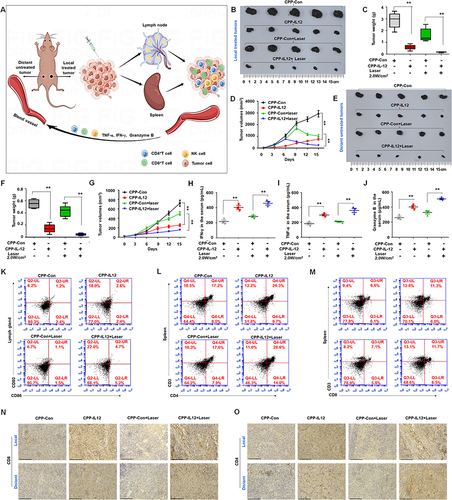
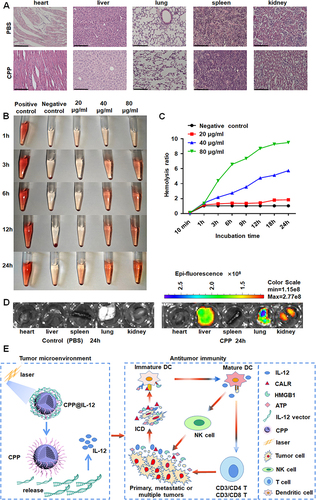
Figure 7 Analyzing the distribution and toxicity of CPP. (A) HE staining demonstrated CPP did not lead to significant damage to the organs of mice. Scale bars=125 μm. (B, C) The blood compatibility of nanoparticles was evaluated by Hemolysis test. (D) The distribution of CPP in mice. (E) CPP-IL-12 nanoparticles could significantly suppress melanoma cell proliferation. On one hand, IL-12 delivery by CPP-IL-12 involves immunotherapy and PTT, which induced IL-12 expression and ICD in tumor environment. On the other hand, the ICD would further activate dendritic cells, NK cells, and T cells to promote antitumor immunity.