Figures & data
Table 1 List of Antibodies Used for the Study
Table 2 Primer Sequences Used for the Study
Table 3 Characteristics of BSA-AuNPs Before Application
Figure 1 Characterization of BSA-AuNPs after preparation. FE-SEM micrograph of (18.3 ± 1.5 nm) BSA-AuNPs deposited on silicon wafer (A). UV-VIS absorption spectrum of BSA-AuNPs (pathlength of 0.4 cm) (B). Size distribution of AuNPs in water (C).
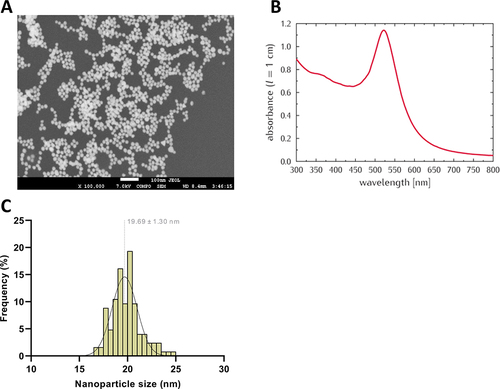
Figure 2 The amount of nanoparticles in mouse liver, kidneys, and spleen after one day (A) and the number of nanoparticles per gram of liver and spleen after one day (B) after a single application of nanoparticles (asterisks represent statistical differences between untreated and treated groups). The amount of nanoparticles in mouse liver, kidneys, and spleen after 120 days (C) and the amount of nanoparticles per gram of liver and spleen after 120 days (D) after a single application of nanoparticles (asterisks represent statistical differences between treated groups). The amount of nanoparticles in the liver after 120 days was significantly lower than after 1 and 30 days (E), while significantly more nanoparticles accumulated in the spleen after 60 and 120 days than after one day of nanoparticle application (F) (asterisks represent statistical differences compared to 120 days (E) or 1 day (F) treated groups). Data represent the mean ± SEM from three mice. Statistical significance among groups: P < 0.05 (*), P < 0.01 (**), and P < 0.001 (***).
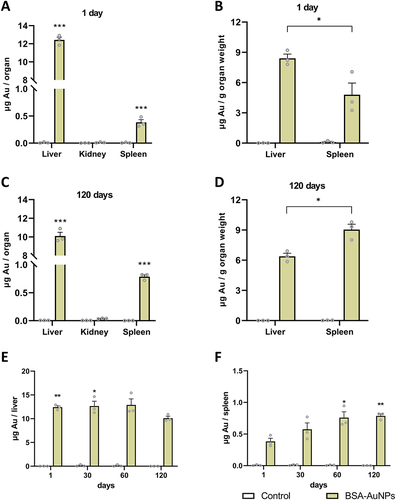
Figure 3 Single administration of nanoparticles resulted in increased spleen weight in the treated mice than in the controls after 120 days of exposure (A), while the liver weight of the treated mice did not change compared to the controls (B). After 120 days, changes in the expression of some pro-inflammatory genes were observed both in the spleen (C) and in the liver (D), which were not changed after 60 days, or with less intensity (E and F). Asterisks represent statistical differences compared to untreated groups. Data from qRT-PCR represent the mean ± SEM of five independent experiments. Statistical significance among groups: P < 0.05 (*), P < 0.01 (**).
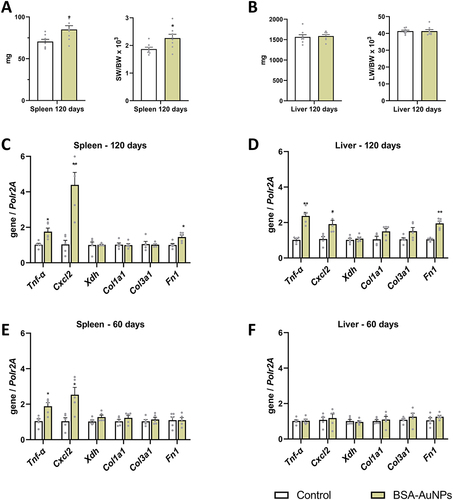
Figure 4 Hematoxylin-eosin staining of liver tissue showed increased infiltration of mononuclear cells (A), partial positivity for F4/80 (B), and enhanced fibronectin deposition (C). Hematoxylin-eosin staining, as well as F4/80 staining of spleen tissue showed any structural disturbances (D and E), but fibronectin detection revealed higher fibronectin content in spleens exposed to BSA-AuNPs for 120 days (F). Differences in fibronectin were also detect between treated and non-treated groups after 120 days by Western blot (G), which was not yet observed at 60 days (H). Data from Western blot represent the mean ± SEM of five independent experiments. Statistical significance among groups: P < 0.01 (**). Magnification (A–C) upper panel 100x, bar 100 µm, lower panel 400x, bar 20 µm. Magnification (D–F) upper panel 40x, bar 200 µm, lower panel 200x, bar 50 µm.
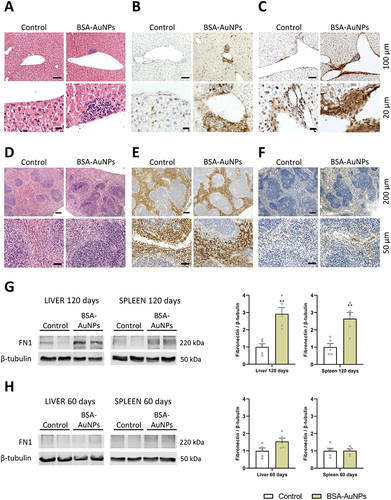
Figure 5 Accumulation of BSA-coated gold nanoparticles in the liver. Area of liver tissue cells showing hepatocytes (Hc); asterisk – a sinusoid in the lumen of which a lymphocyte is present (L); the lower part of the sinusoid is lined by an endothelial cell with a large cell nucleus; long arrow - clusters of gold nanoparticles located in the cytoplasm near the cell nucleus (A). Detail from figure (A) (yellow square); long arrow - clusters of gold nanoparticles in the endothelial cell cytoplasm; white n - cell nucleus (B). Phagocytic cell with gold nanoparticles (yellow square, long arrow) located in the sinusoid (asterisk); short arrows – phagocyte cytoplasmic protrusions; white n – cell nucleus of a phagocyte; Hc - liver cell (C). Detail from figure (C) (yellow square); long arrow - clusters of gold nanoparticles in a phagocytic cell accumulated in a large phagolysosome (Ph); short arrows – phagolysosome membrane (D).
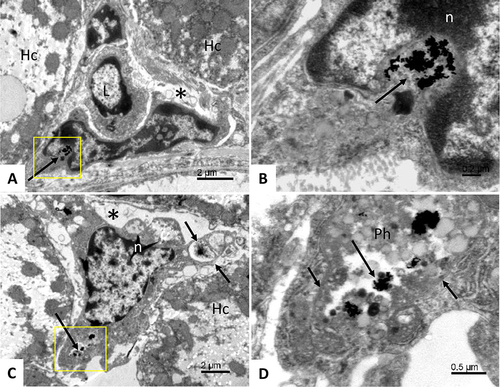
Figure 6 Accumulation of BSA-coated gold nanoparticles in the white pulp of spleen. Area of spleen tissue cells showing an supporting elongated cell (S) in the cytoplasm of which gold nanoparticles can be observed (yellow square); asterisk – a sinusoid; L –lymphocytes (A). Detail from figure A (yellow square); long arrow - clusters of gold nanoparticles located in the lysosome (white asterisk) (B). Area of endothelial cell; long arrow - gold nanoparticles found in the lysosome of the cell (white asterisk); n - cell nucleus (C). Detail from figure C; view of a cluster of gold nanoparticles (long arrow) located in a lysosome (white asterisk) (D) A macrophagic cell (Mc) in the space of the sinusoid (asterisk); scattered gold nanoparticles are found in the cytoplasm of the macrophage (yellow square) (E) Detail from figure E (yellow square); view of scattered gold particles (short arrows) localized in the macrophage lysosome (F).
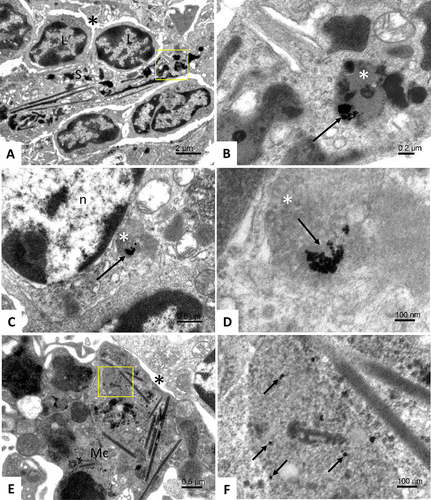
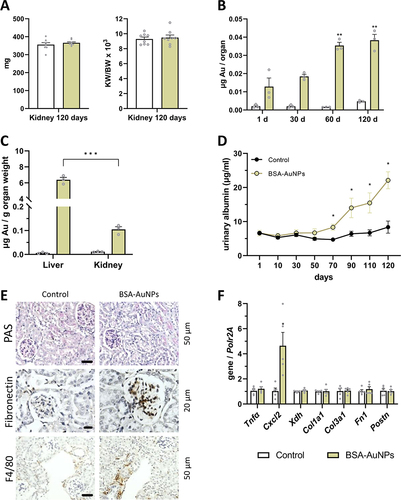
Figure 7 After 120 days from a single administration of nanoparticles, the kidney weight of the treated mice did not change compared to the control mice (A). Over time, there is an increased accumulation of nanoparticles in the kidneys (B), but this number of nanoparticles is small compared to the number of nanoparticles in the liver (C). Nevertheless, in mice that were treated with nanoparticles, after 70 days the level of albumin in the urine slightly increased compared to control mice (D). Higher amount of mesangium and fibronectin were identified in glomeruli. F4/80 positive cells were also detected in the renal tissue in BSA-AuNPs exposed mice (E). After 120 days, changes in the expression of Cxcl2 gene were observed in the kidney (F). Asterisks represent statistical differences between untreated and treated groups (C, D and F), or differences compared to 1 day (B). Data represent the mean ± SEM from three independent experiments (for qRT-PCR from five independent experiments and for level of albumin from eight independent experiments). Statistical significance among groups: P < 0.05 (*), P < 0.01 (**), and P < 0.001 (***). Magnification upper and lower panel 200x, bar 50 µm, middle panel 400x, bar 20 µm.