Figures & data
Figure 1 Morphological and optical characterizations of CRC-CDs. (A) Transmission electron microscopy (TEM) images. (B) High-resolution TEM image of CRC-CDs and lattice spacing (Red arrow indicates) of CRC-CDs (d = 0.216 nm). (C) Particle size distribution histogram. (D) X-ray diffraction pattern. (E) Ultraviolet–visible spectrum. (F) Fourier transform infra-red spectrum. (G) Fluorescence spectra for excitation and emission. (H) Fluorescence spectra of CRC-CDs with different excitation wavelengths.
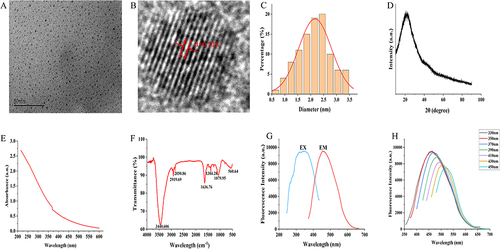
Figure 2 The surface composition and elemental analysis of the prepared CRC-CDs by XPS. (A) X-ray photoelectron spectroscopy survey of CRC-CDs. (B) C1s. (C) O1s. (D) N1s.
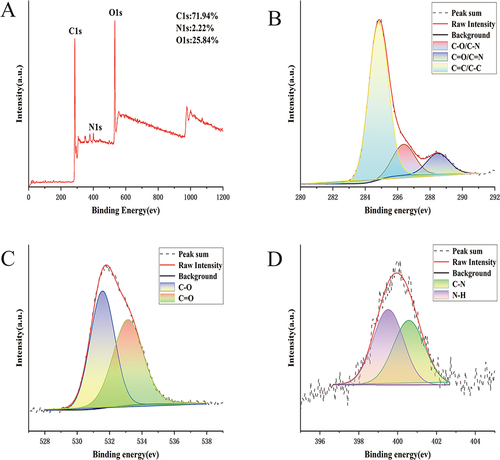
Figure 3 CRC-CDs pretreatment improves cardiac function and reduces ECG ST in rats. (A) Control group. (B) Iso group. (C) Propranolol group. (D) Low-dose CRC-CDs group. (E) Medium-dose CRC-CDs group. (F) High-dose CRC-CDs group. (G) Changes in the ST segment of the ECG in each group of rats. Date are represented as means ± SD (n=8). ##P < 0.01 compared with the control group, **P < 0.01compared with the Iso group.
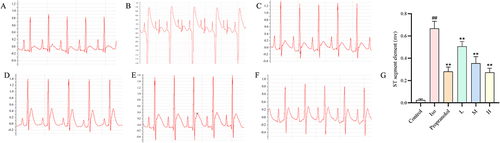
Figure 4 The echocardiographic results showed that pretreatment with CRC-CDs increased the levels of EF and FS in rats. (A) Control group. (B) Iso group. (C) Propranolol group. (D) Low-dose CRC-CDs group. (E) Medium-dose CRC-CDs group. (F) High-dose CRC-CDs group. (G) Left ventricular ejection fraction of rats in each group. (H) Left ventricular shortening fraction in all groups of rats. Date are represented as means ± SD (n = 8). ##P < 0.01 compared with the control group, **P < 0.01 compared with the Iso group.
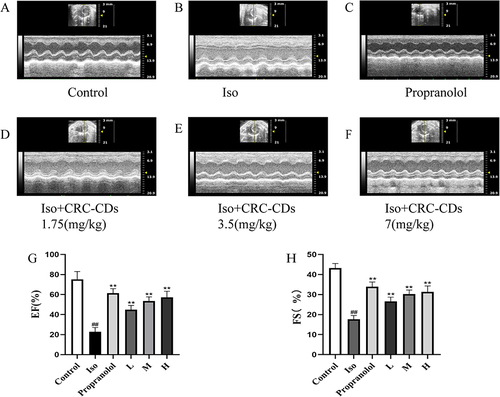
Figure 5 Pretreatment with CRC-CDs improved ISO-induced myocardial ischaemia and reduced relative heart weight in rats. (A) Control group. (B) Iso group. (C) Propranolol group. (D) Low-dose CRC-CDs group. (E) Medium-dose CRC-CDs group. (F) High-dose CRC-CDs group. (G) Heart index of rats in each group. Date are represented as means ± SD (n = 8). ##P < 0.01 compared with the control group, **P < 0.01 compared with the Iso group.
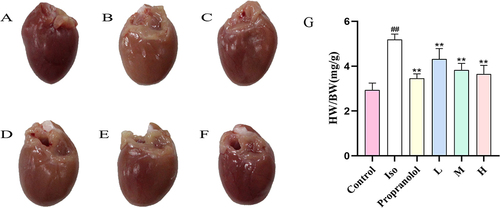
Figure 6 Histopathological changes in rat myocardium. ISO induced damage such as necrosis, edema, inflammatory cell infiltration (black arrow) and collagen fibril deposition (red arrow) in rat myocardium, whereas CRC-CDs improved the histopathological changes in rat myocardium.
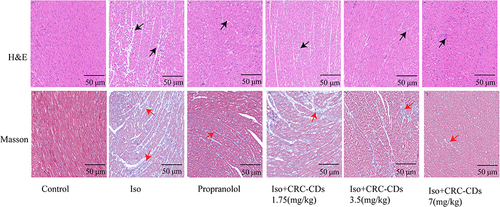
Figure 7 Photomicrographs of TTC staining of myocardial tissue from various groups of rats. (A) Control group. (B) Iso group. (C) Propranolol group. (D) Low-dose CRC-CDs group. (E) Medium-dose CRC-CDs group. (F) High-dose CRC-CDs group. (G) Percentage of myocardial infarct area by semi-quantification. Date are represented as means ± SD (n = 5). ##P < 0.01 compared with the control group, **P < 0.01 compared with the Iso group.
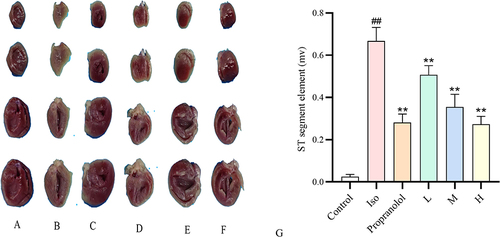
Figure 8 Effect of CRC-CDs on serum cardiac marker enzymes (A-D) and blood lipids (E-H) in various groups of rats. (A) LDH levels in serum. (B) AST levels in serum. (C) CK levels in serum. (D) CK-MB levels in serum. (E) LDL levels in serum. (F) HDL levels in serum. (G) TC levels in serum. (H) TG levels in serum. Date are represented as means ± SD (n = 8). ##P < 0.01 compared with the control group, **P < 0.01 and *P < 0.05 compared with the Iso group.
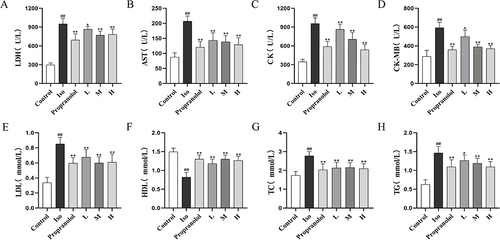
Figure 9 Effect of CRC-CDs on myocardial antioxidant activity (A-D) and Na+-K+-ATPase and Ca2+-Mg2+-ATPase (E-F) activities in various groups of rats. (A) SOD levels in tissues. (B) MDA levels in tissues. (C) GSH levels in tissues. (D) CAT levels in tissues. (E) Na+-K+-ATPase activity in tissues. (F) Ca2+-Mg2+-ATPase activity in tissues. Date are represented as means ± SD (n = 8). ##P<0.01 compared with the control group, **P < 0.01 and *P < 0.05 compared with the Iso group.
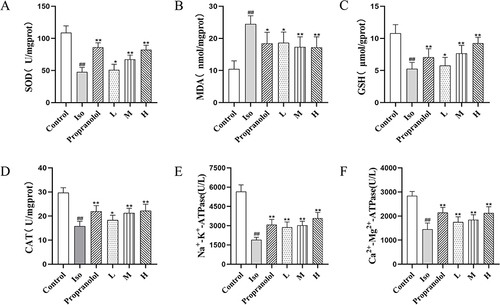
Figure 10 Apoptosis levels in different groups of rat cardiomyocytes (magnification = 400 ×, The nuclei of DAPI-positive normal cardiomyocytes fluoresced blue; the nuclei of TUNEL-positive apoptotic cardiomyocytes fluoresced green). (A) Control group. (B) Iso group. (C) Propranolol group. (D) Low-dose CRC-CDs group. (E) Medium-dose CRC-CDs group. (F) High-dose CRC-CDs group. (G) Percentage of TUNEL-positive cells. Date are represented as means ± SD (n = 5). ##P < 0.01 compared with the control group, **P < 0.01 and *P < 0.05 compared with the Iso group.
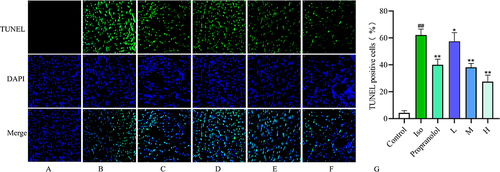
Figure 11 Effect of different concentrations of CRC-CDs on the viability of H9c2 cells. Significantly different compared to the control group at **P < 0.01 and *P < 0.05.
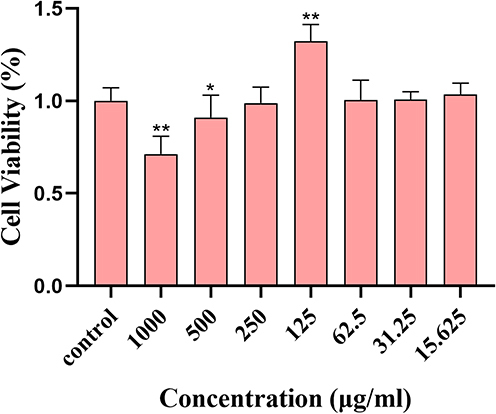
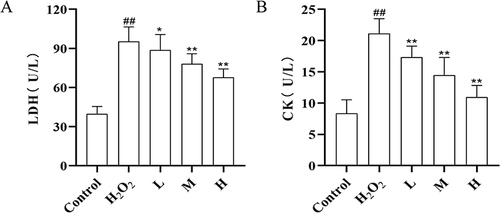
Figure 12 Effect of CRC-CDs on cardiac myosin levels in supernatants of H2O2-induced H9c2 cells. (A) LDH levels in the supernatant. (B) CK levels in the supernatant. Date are represented as means ± SD (n = 6). ##P < 0.01 compared with the control group, **P < 0.01 and *P < 0.05 compared with the model group.