Figures & data
Figure 1 The synthetic route and nuclear magnetic resonance (NMR) characterization of the prodrug. (A) Schematic representation of the synthesis route of the prodrug. NMR spectra of the prodrug, including the hydrogen spectrum (B) and the carbon spectrum(C).
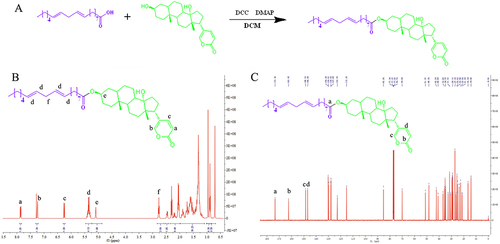
Figure 2 The particle size distribution, polydisperse index (PDI), Zeta potential, and transmission electron microscopic (TEM) images of different nanoparticles. (A–E) Particle size distribution and TEM images of Leb-PSN, 9:1-PSN, 8:2-PSN, 7:3-PSN, and 6:4-PSN; (F–H) Average particle size, PDI, and Zeta potential values of Leb-PSN, 9:1-PSN, 8:2-PSN, 7:3-PSN, and 6:4-PSN. Data are presented as mean ± SD, n=3. One-way ANOVA (one-sided) with Dunnett’s multiple comparisons test was used for data analysis, where ns indicates no significance, *P < 0.05, **P < 0.01, and ****P < 0.0001.
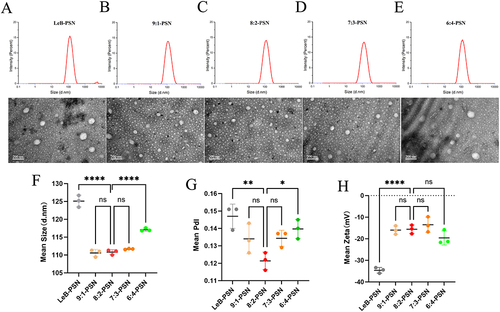
Figure 3 The particle size variation of different nanoparticles after storage at 4°C (A) and 25°C (B) for 30 days, and stability assessment in phosphate-buffered saline (PBS, pH 7.4) over 24 hours (C). Insert: the Tyndall effect image with different nanoparticles of Leb-PSN (1), 9:1-PSN (2), 8:2-PSN (3), 7:3-PSN (4) and 6:4-PSN (5) under direct laser beam irradiation. Data are presented as mean ± SD, n=3. Statistical analysis was performed using two-tailed Student’s t-test, ***P < 0.001.
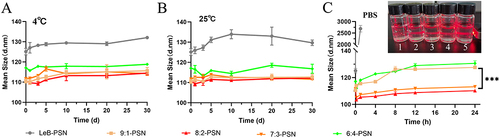
Figure 4 The drug release profiles of different nanoparticles under enzymatic (A) and non-enzymatic conditions (B). Release percentages of different nanoparticles after 48 hours under enzymatic conditions (C). One-way ANOVA (one-sided) with Dunnett’s multiple comparisons test was used for data analysis. (D) Drug release profiles of LeB-PSN in media containing Tween 80 and DPSE2k. Statistical analysis was performed using two-tailed Student’s t-test, where ns indicates no significance, **P < 0.01, and ****P < 0.0001. (E) Schematic representation of the drug release mechanism of nanoparticles under enzymatic conditions.
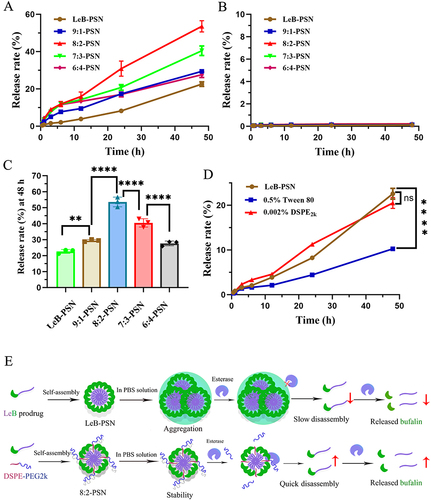
Figure 5 The cytotoxicity of Bufalin (BFL) and different nanoparticles on KYSE150 cells. (A–F) The cytotoxicity of free BFL solution, Leb-PSN, 9:1-PSN, 8:2-PSN, 7:3-PSN, and 6:4-PSN at different time points (24, 48, and 72 hours). (G) The IC50 values of different nanoparticles on KYSE150 cells at different time points (24, 48, and 72 hours). One-way ANOVA (one-sided) with Dunnett’s multiple comparisons test was used for data analysis, where ns indicates no significance, *P < 0.05, **P < 0.01, ***P < 0.001, and ****P < 0.0001.
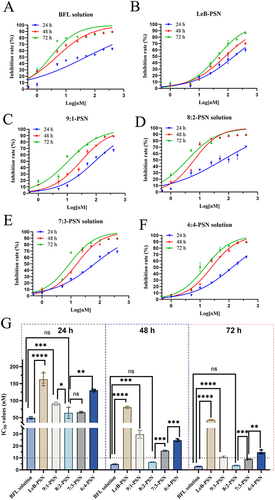
Figure 6 The cell uptake in KYSE150 cells. The fluorescence intensity images were obtained using a fluorescence microscope and the fluorescent intensity values were calculated using the Image software at 1hours (A) and 6 hours (B) after treatment with various nanoparticles on KYSE150 cells. Statistical analysis was performed using two-tailed Student’s t-test, where **P < 0.01, ***P < 0.001, and ****P < 0.0001.
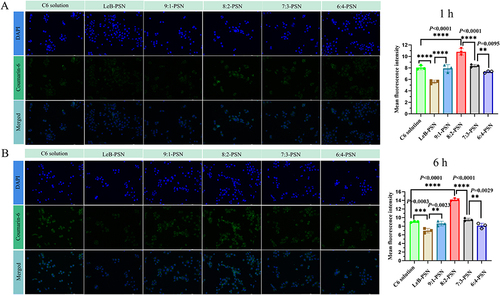
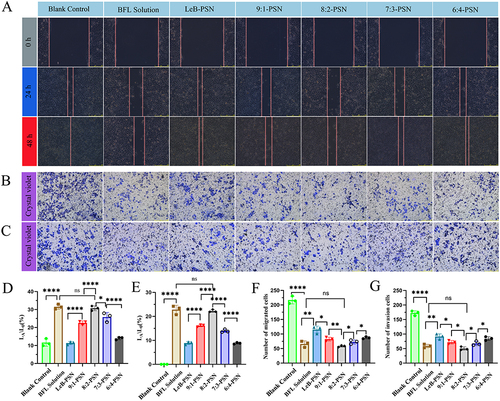
Figure 7 The scratch (A), migration (B), and invasion (C) assays of different nanoparticles on esophageal cancer cells. Changes in the scratch area relative to the blank control group after 24 hours (D) and 48 hours (E) of nanoparticle treatment. Cell count images of migration (F) and invasion (G) in different groups after 24 hours of nanoparticle treatment. Statistical analysis was performed using two-tailed Student’s t-test, where ns indicates no significance, *P < 0.05, **P < 0.01, and ****P < 0.0001.