
Figures & data
Figure 1 The origin of cancer associated fibroblast (CAFs): the main original cell of CAFs are tissue normal fibroblasts, stellate cells, mesenchymal stem cells, endothelial cells, epithelial cells, adipocytes cells and perivascular cells. These cells can transform into CAFs by Epithelial–mesenchymal transition (EMT) pathway and Endothelial-to-mesenchymal transition (EndMT) or be activated by cytokines including TGF-β, SDF-1, WNT-3, IGF-3, CCL2, CCL5 and CXCL2.
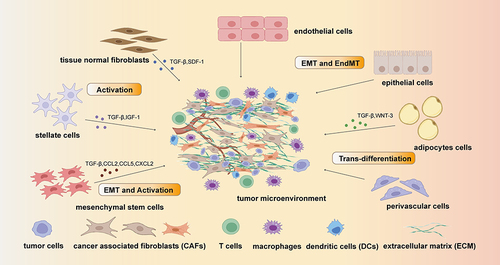
Figure 2 The heterogeneity of CAFs: the main subtypes of CAFs are defined by their features. In the classification of mCAFs, the overexpressed genes such as ACTA2, CD36 and PDPN are define as the subtype of mCAFs. And subtypes of the iCAFs with different functions are define by their secreted cytokines. The way of defining apCAFs are similar to myCAFs but the markers are usually human leukocyte antigens and cluster of differentiations (CD).
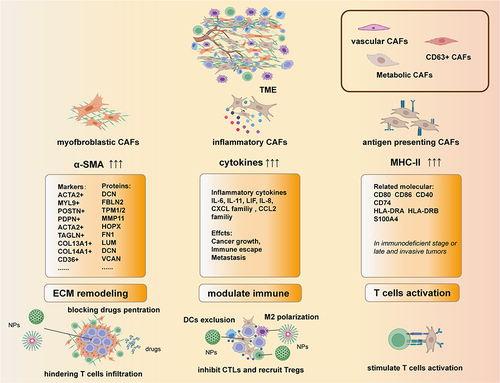
Figure 3 Crosstalk of CAFs and immune cells: CAFs can inhibit CD8+ T cells by inducing exclusion, dysfunction and exhaustion and they can also inhibit their proliferation while induce the proliferation of Tregs. CAFs can induce M2 polarization while M2 can also enhance the function of CAFs. This kind mutual support also can be found in the interaction of CAFs and MDSCs. CAFs also can disrupt the functions of DCs and NK cells while recruit mast cells.
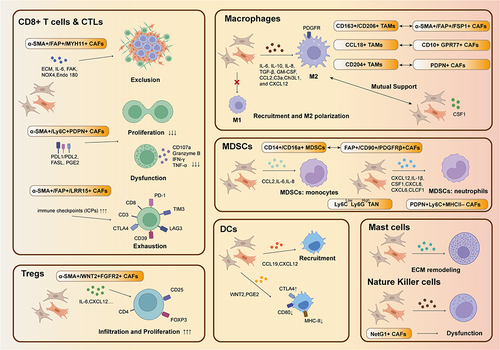
Table 1 Drugs for Targeting CAFs in Preclinical and Clinical Trials
Table 2 Constructed NPs and Their Effects for Targeting CAFs
Figure 4 Design, characteristics and effects of IR780/DPPC/BMS. (A) Scheme of IR780/DPPC/BMS. (B) Synthetic route of IR780-PEG-ODC. (C) In vitro NIR-triggered drug release profiles. (D) Transmission electron microscope (TEM) images of IR780/DPPC/BMS at different temperatures. (E) Cellular uptake and responsive drug release in 4T1 tumor cells. (F) In vivo photothermal effect. (G) Tumor volumes of 4T1 tumor-xenografted mice in different treatment groups. (H) The quantitative analysis of pulmonary metastatic nodules in various treatment groups. (I) Detection of released cytokines in primary tumor after synergistic immuno-photothermal therapy. *:P<0.05; **:P<0.01; ***P<0.001. Reprinted from Cancer Letters, volume 522, Tan Y-N, Li Y-P, Huang J-D, et al. Thermal-sensitive lipid nanoparticles potentiate anti-PD therapy through enhancing drug penetration and T lymphocytes infiltration in metastatic tumor. 238–254, Copyright 20221, with permission from Elservier.Citation150
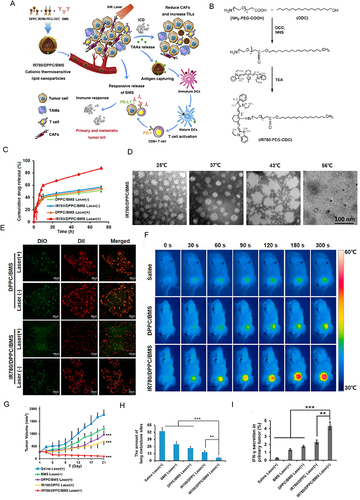
Figure 5 Docetaxel (DTX)-Mediated Uptake and Retention of Gold Nanoparticles (GNPs) in Tumor Cells and in CAFs. (A) Schematic diagram of functionalized GNP. (B) TEM of GNPs. (C) Zeta Potentials for pure GNPs. Scheme of transportation of GNPs in cells (D) and effects of DTX on cell division (E). Confocal microscopy images of GNPs transportation (F) and effects of DTX on cell division (G). (H) Effect of DTX on GNP. Retention of NPs in the presence of DTX in tumor cells (I) and CAFs (J). (L) Retention of GNPs in tumor cells and CAFs (K) post recovery. *:P<0.05. Reprinted from Alhussan A, Bromma K, Perez MM, et al. Docetaxel-mediated uptake and retention of gold nanoparticles in tumor cells and in cancer-associated fibroblasts. Cancers (Basel). 2021;13(13):3157. Creative Commons.Citation197
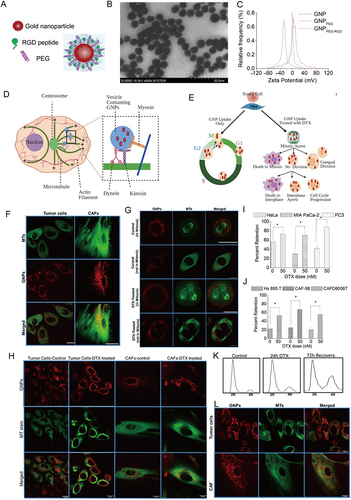
Figure 6 Fibroblast growth factor 2 (FGF2) engineered SPIONs attenuate tumor stroma and potentiate the effect of chemotherapy in pancreatic tumor. (A) Schematic representation of conjugation of FGF2 to SPION. (B) Binding of FGF2-SPION on non-activated human pancreatic stellate cells (hPSCs) and activated hPSCs. Western blots demonstrating the differentiation-related biomarkers (C) and representative immunofluorescence images showing the effect of FGF2 and FGF2-SPION on the protein expression of α-SMA and col-1 in TGF-β-activated hPSCs (D). Effect of FGF2-SPION on hPSCs migration (E) and contractility (F). (G) Effect of FGF2-SPIONs on the tumor stroma and gemcitabine efficacy in 3D heterospheroids. (H) Magnetic driven iron oxide accumulation. *P<0.05; **P<0.01. Reprinted from Mardhian DF, Vrynas A, Storm G, et al. FGF2 engineered SPIONs attenuate tumor stroma and potentiate the effect of chemotherapy in 3D heterospheroidal model of pancreatic tumor. Nanotheranostics. 2020;4(1):26–39. Creative Commons.Citation157
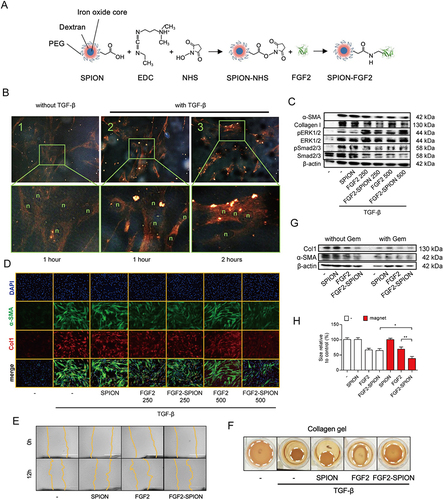
Figure 7 On-demand responsive nanoplatform mediated targeting of CAFs and down-regulating mtROS-PYK2 signaling for antitumor metastasis. (A) Disintegration of the on-demand successively responsive HPBC@TRP/NPs and its therapeutic mechanism. (B) TEM images of HPBC@TRP/NPs. (C) Zeta potential reversal characteristic. (D) Evaluation of the relative cell viability and mechanism of the apoptosis signal pathway. (E) CLSM images of α-SMA activated CAFs in 4T1/NIH3T3 cells treated with PFD and HPBC@TRP/NPs. Down-regulation of the mitochondrial oxidation system and cancer associated fibroblasts in vitro: Western blot protein expression levels of PYK2 (F), α-SMA (G), and TGF-β (G) in 4T1/NIH3T3 co-cultured cells. (H) Enhanced in vivo therapeutic effect. (I) Normalization of the tumor ECM to remodel TME. (J) Modulation of TIME in 4T1/NIH3T3 tumors after treatments. Reprinted from Zuo T, Zhang J, Yang J, et al. On-demand responsive nanoplatform mediated targeting of CAFs and down-regulating mtROS-PYK2 signaling for antitumor metastasis. Biomater Sci. 2021;9(5):1872–1885. 2021 © Royal Society of Chemistry.Citation165
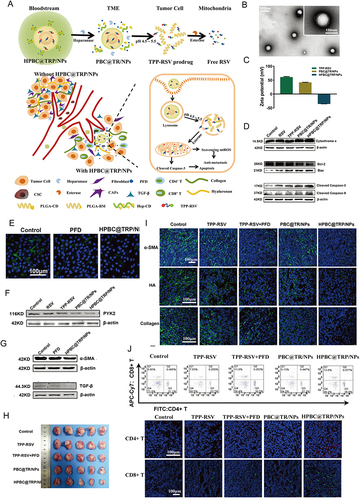
Figure 8 Prodrug polymeric micelles integrating CAFs and synergistic chemotherapy for gastric cancer (GCs). (A) Schematic overview of the composition and synergistic mechanisms. (B) TEM images of PSN38 and PSN38@TPL-nsa NPs. (C) Low dose of TPL inactivated CAFs and inhibited CAFs. (D) Apoptotic analysis of BGC-823 and MKN45 cells after the treatment of TPL, SN38 or a combination of SN38 and TPL for 24 h in the co-culture and mono-culture model respectively. (E) The antitumor efficiency of PSN38@TPL-nsa in GC PDX model. (F) PSN38@TPL-nsa remodeled GC microenvironment in vivo. Reprinted from Zheng S, Wang J, Ding N, et al. Prodrug polymeric micelles integrating cancer-associated fibroblasts deactivation and synergistic chemotherapy for gastric cancer. J Nanobiotechnology. 2021;19(1):381. Creative Commons.Citation168
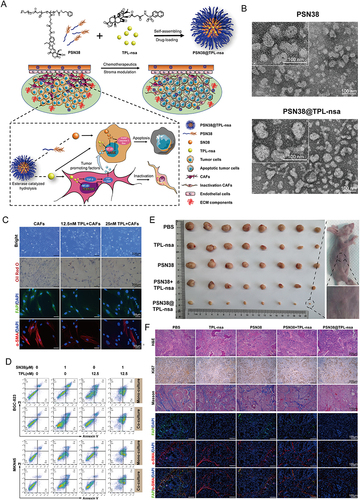
Figure 9 Targeting CAFs by dual-responsive lipid-albumin NPs to enhance drug perfusion for pancreatic tumor therapy. (A) Diagram of dual-responsive lipid-albumin NPs (HSA-PTX@CAP-ITSL) (B) TEM images of HSA-PTX, CAP-ITSL and HSA-PTX@CAP-ITSL. (C) The PTX release profiles of different formulations incubated with FAP-α. (D) cellular uptake after TGF-β activated NIH 3T3 cells incubated with different formulations. (E) Rhodamine B distribution of different treatment groups. (F) IR thermal images of subcutaneous tumor-bearing mice in different treatment groups.(G) H&E staining, α-SMA staining and Caspase-3 staining of tumor tissues. Reprinted from J Control Release, volume 321, Yu Q, Qiu Y, Li J, et al. Targeting cancer-associated fibroblasts by dual-responsive lipid-albumin nanoparticles to enhance drug perfusion for pancreatic tumor therapy. 564–575, Copyright 2020, with permission from Elsevier.Citation184
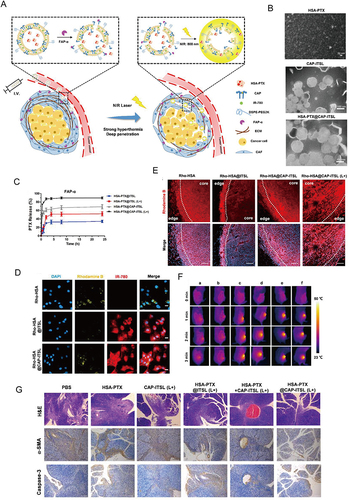
Figure 10 Metabolic Reprogramming by Dual-targeting Biomimetic NPs for Enhanced Tumor Chemo-Immunotherapy. (A) Scheme of PTX/PFK15-SLN@[4T1-3T3] NPs. (B) Western blot assay of 4T1 membrane (4T1m), 3T3 membrane (3T3m), 4T1-3T3 membrane (4T1m-3T3m), and SLN@[4T1-3T3] NPs for 4T1 membrane marker CD44and 3T3 membrane marker FAP-α. (C) CLSM images of the SLN@[4T1-3T3] NPs and a physical mixture of SLN@4T1 NPs and SLN@3T3 NPs. (D) Representative TEM images of PTX/PFK15-SLN and PTX/PFK15-SLN@[4T1-3T3] NPs. (E) CLSM images of 4T1, 3T3, B16F10, Pan02 and C166 cells stained with DAPI and cultured with DiD-labeled SLN@[4T1-3T3] NPs. (F) Representative CLSM images in tumor sites. The dotted line inside indicated CAFs. (G) Antitumor effect evaluation in vivo. (H) Representative flow cytometric images of the tumor CD4+ T cells, CD8+ T cells and Treg cells (gated by CD25). Reprinted from Acta Biomater, volume 148, Zang S, Huang K, Li J, et al. Metabolic reprogramming by dual-targeting biomimetic nanoparticles for enhanced tumor chemo-immunotherapy. 181–193, Copyright 2022, with permission from Elsevier.Citation215
![Figure 10 Metabolic Reprogramming by Dual-targeting Biomimetic NPs for Enhanced Tumor Chemo-Immunotherapy. (A) Scheme of PTX/PFK15-SLN@[4T1-3T3] NPs. (B) Western blot assay of 4T1 membrane (4T1m), 3T3 membrane (3T3m), 4T1-3T3 membrane (4T1m-3T3m), and SLN@[4T1-3T3] NPs for 4T1 membrane marker CD44and 3T3 membrane marker FAP-α. (C) CLSM images of the SLN@[4T1-3T3] NPs and a physical mixture of SLN@4T1 NPs and SLN@3T3 NPs. (D) Representative TEM images of PTX/PFK15-SLN and PTX/PFK15-SLN@[4T1-3T3] NPs. (E) CLSM images of 4T1, 3T3, B16F10, Pan02 and C166 cells stained with DAPI and cultured with DiD-labeled SLN@[4T1-3T3] NPs. (F) Representative CLSM images in tumor sites. The dotted line inside indicated CAFs. (G) Antitumor effect evaluation in vivo. (H) Representative flow cytometric images of the tumor CD4+ T cells, CD8+ T cells and Treg cells (gated by CD25). Reprinted from Acta Biomater, volume 148, Zang S, Huang K, Li J, et al. Metabolic reprogramming by dual-targeting biomimetic nanoparticles for enhanced tumor chemo-immunotherapy. 181–193, Copyright 2022, with permission from Elsevier.Citation215](/cms/asset/3e2fe968-bb1c-464c-b201-e289ef2a615a/dijn_a_12301878_f0010_c.jpg)