Figures & data
Table 1 Surface Charge (ζ) and Mw of Model Cargos; ζ, Hydrodynamic Diameter (DH), and Mw of Biodynamers
Scheme 1 Formation of PNCs through electrostatic Interaction between R-biodynamer and f-OVA.
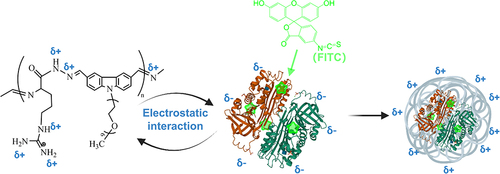
Figure 1 DH (left y-axis) and PDI (right y-axis) of f-OVA-PNCs at different weight ratio. White bar is DH and red dot is PDI (A). Zeta potential of f-OVA-PNCs at different weight ratios (B). Size distribution of f-OVA-PNCs at 10: 5 (w/w), measured by DLS (C). Morphology of f-OVA-PNCs at 10: 5 (w/w), measured by SEM (D).
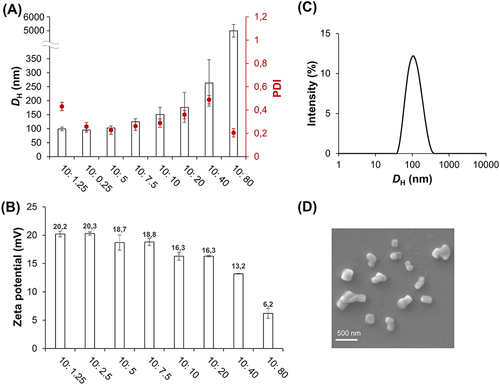
Figure 2 EE%, LC%, and theoretical loading capacity (TLC%) of f-OVA-PNCs at different weight ratios (A). Physical stability of 100 μg/mL f-OVA-PNCs (10: 5, w/w) for 48 h (B).
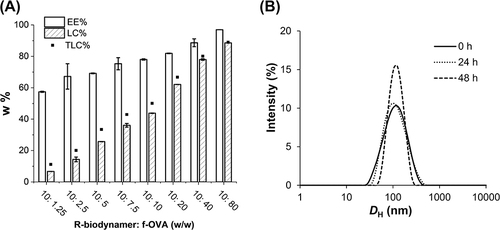
Table 2 DH, PDI, and DCR of OVA-, IH-, and GLP-1-Loaded PNCs for 2 h
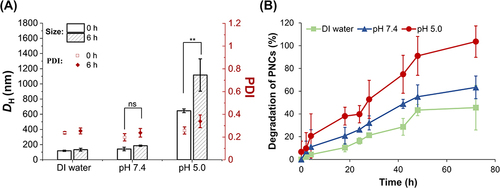
Figure 3 pH-Responsive size change of 100 μg/mL f-OVA-PNCs (10: 5, w/w) in DI water, pH 7.4 (10 mM PB), and pH 5.0 (10 mM AB) for 6 h (A). Acid-responsive degradation of f-OVA-PNCs (10: 5, w/w) in DI water, pH 7.4 (10 mM PB), and pH 5.0 (10 mM AB) for 48 h (B). The comparison of mean size changes in PNCs at 0 and 6 h under pH 7.4 and pH 5.0, respectively, was conducted using a T-test. P** ˂ 0.05 was considered significant, and pns > 0.05 were no statistical difference.
Scheme 2 Preparation of Protein-loaded DE-NPs via DE method.
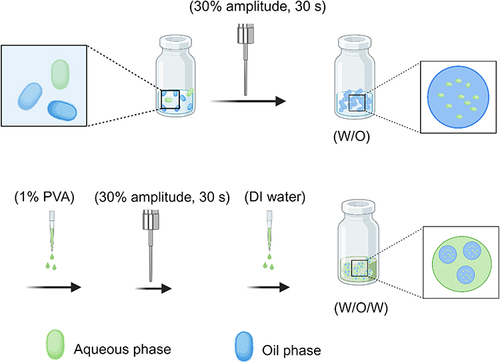
Table 3 DH (SD ≤ ± 50), PDI (SD ≤ ± 0.05), ζ (SD ≤ ± 0.7), and DCR (SD ≤ ± 3000) of f-OVA-DE-NPs
Figure 4 Size distribution of DE-NPs (R-biodynamer: f-OVA, 10: 1, w/w) in aqueous solution (A). Morphology of DE-NPs (R-biodynamer: f-OVA, 10: 1, w/w), measured by SEM (B).
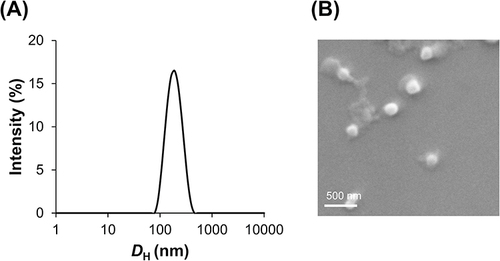
Figure 5 EE%, LC% and TLC% of f-OVA loaded DE-NPs with various amounts of PLGA (R-biodynamer: f-OVA: PLGA, 10: 1: x, w/w/w) (A). Stability of f-OVA-DE-NPs-0% PLGA (B) and f-OVA-DE-NPs-10% PLGA (C) in DI water for 48 h.
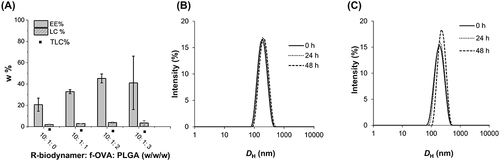
Table 4 DH and PDI of OVA (or Insulin, or GLP-1)-DE-NPs-R Measured After 48 h at R.t
Figure 6 pH-responsive size change of 100 μg/mL f-OVA-DE-NPs-0% PLGA and DE-NPs-10% PLGA in DI water, pH 7.4 (10 mM PB), and pH 5.0 (10 mM AB) for 6 h (A). Acid-responsive degradation of f-OVA-DE-NPs-0% PLGA (B) and DE-NPs-10% PLGA (C) in DI water, pH 7.4 (10 mM PB), and pH 5.0 (10 mM AB) for 48 h. The comparison of mean size changes in PNCs at 0 and 6 h under pH 7.4 and pH 5.0, respectively, was conducted using a T-test. P** ˂ 0.05 was considered significant, and pns > 0.05 were no statistical difference.
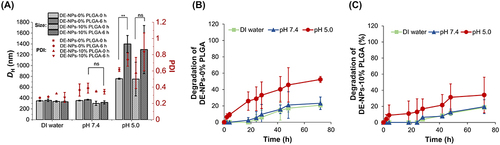
Figure 7 Release dynamic f-OVA in PNCs (A), DE-NPs-0% PLGA (B), and DE-NPs-10% PLGA (C) in pH 5.0 (10 mM acetate buffer) and pH 7.4 (10 mM PB)2.
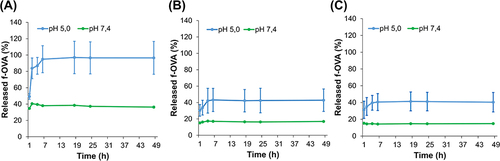
Figure 8 Cell viability of f-OVA-loaded NPs on A549 cells analyzed by MTT assay. White bar is f-OVA-PNCs-R (10: 5, w/w); light gray bar is f-OVA-DE-NPs-0% PLGA; dark gray bar is f-OVA-DE-NPs-10% PLGA. (n=6). A one-way ANOVA was employed to assess the statistical differences in cell viability among PNCs, DE-NPs-0% PLGA, and DE-NPs-10% PLGA. The red lines represent the standard values of the control group.
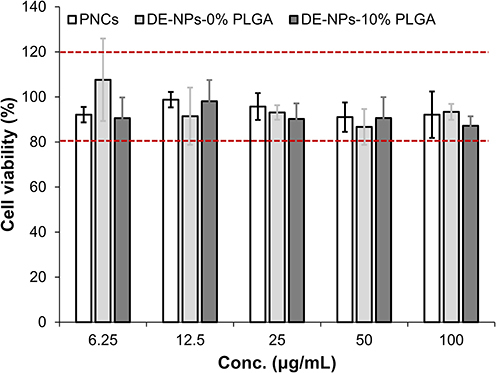
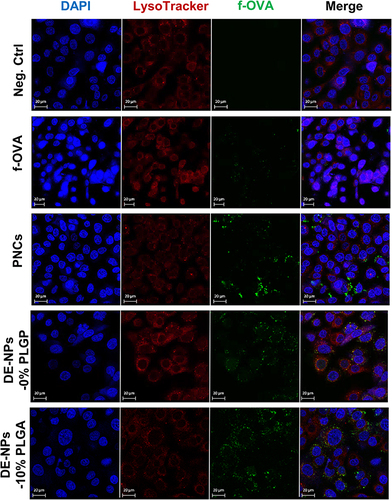
Figure 9 A549 cellular uptake of f-OVA-loaded NPs after 6 h incubation. DAPI stained nucleus in blue, LysoTracker™ Red DND-99 stained endosome/lysosome in red, and f-OVA in green.