
Figures & data
Figure 1 Schematic illustration the of preparation process of MDR@SHDS.
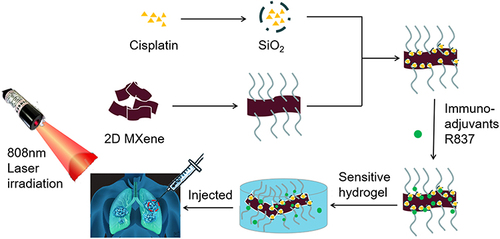
Figure 2 Characterization of PEG-MXene@DDP@R837 and MDR@SHDS. (a) TEM of PEG-MXene; (b) TEM of PEG-MXene@DDP@R837; (c) XPS; (d) Controlled release properties of MDR@SHDS; (e) The morphology of MDR@SHDS at different temperatures of 37°C and 55°C.
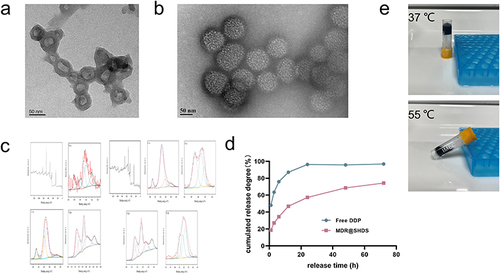
Figure 3 In vitro photothermal performance of MDR@SHDS. (a and b) The heating curves of different upon 808 nm laser irradiation (2.0 W/cm2); (c and d) The heating curves of MDR@SHDS at different concentrations; (e) The heating curves upon 5-cycles 808 nm laser exposure (2.0 W/cm 2).
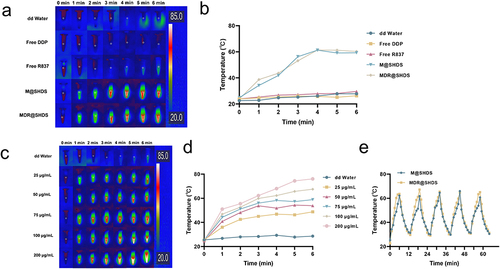
Figure 4 Controlled-release characteristics of M@SHDS. In vivo near-infrared imaging of 0.1 mL, Cy7 solution (0.015 mg/mL), and M@SHDS loaded with equivalent Cy7 in mice subcutaneously at different time points (1 h, 6 h, 24 h, 48 h, 72 h).
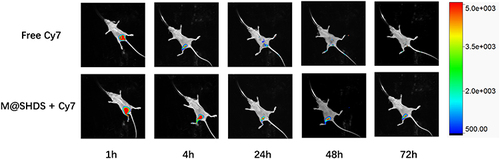
Figure 5 In vitro and in vivo biocompatibility assay. (a) Relative cell viabilities of 3T3, Lewis, and RAW264.7 cells exposed to different concentrations of M@SHDS for 24 h; (b and c) The hemolysis assay of various concentrations of M@SHDS and MDR@SHDS.
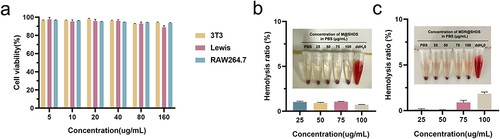
Figure 6 Photographs, HE staining, and Masson staining of M@SHDS in mice subcutaneously at different time points (30 min, Day 7, 14, 21, 28).
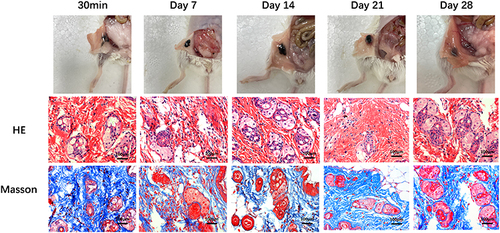
Figure 7 In vitro cancer cellular viabilities, proliferation (a) Cellular viabilities of MDR@SHDS with or without PTT (b and c) EdU fluorescence images after treatment with PTT combined with PBS, M@SHDS, and MDR@SHDS.(The label ** indicates p < 0.01, and the label * indicates p < 0.05).
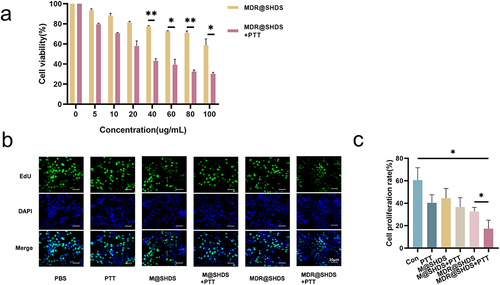
Figure 8 In vitro cancer cellular apoptosis (a and b) TUNEL fluorescence images after treatment with PTT combined with PBS, M@SHDS, and MDR@SHDS. (The label *** indicates p < 0.001).
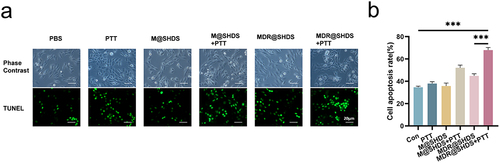
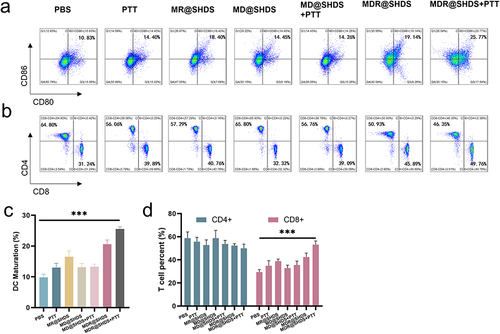
Figure 9 (a and b) Expression levels of surface molecules (CD80 and CD86) on BMDCs after various treatments; (c) Quantification of expression levels of CD80 and CD86 on the surface of BMDCs. (The label *** indicates p < 0.001).
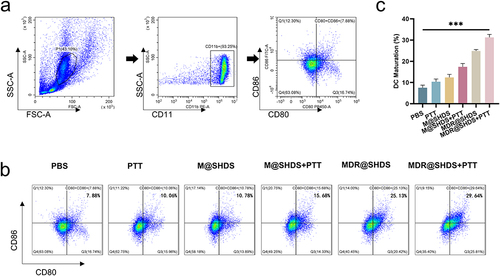
Figure 10 Thermal images of mice bearing tumor after injection of PBS or MDR@SHDS, followed by being exposed to 808 nm irradiation.
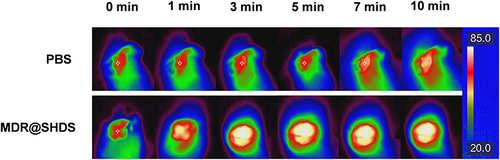
Figure 11 (a) Images of tumors at 13 days post-treatment; (b) HE stains of tumors at 13 days post-treatment.
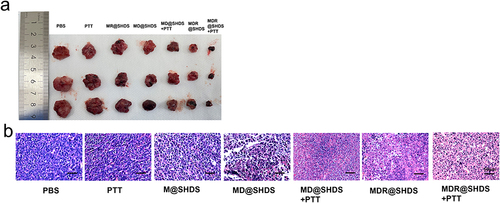
Figure 12 (a) Tumor growth curves. (b) Body weight changes of C57 mice bearing Lewis tumors were recorded every other day after different treatments.
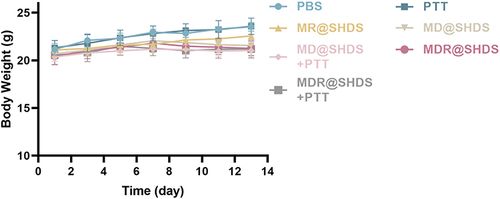
Figure 13 H&E staining of mice heart, liver, spleen, lung, and kidney after PBS and MDR@SHDS treatments.
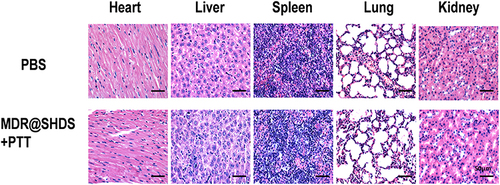
Figure 14 (a and c) matured DCs in lymph node; (b and d) cytotoxic CD8+ T cells and CD4+ T cells in spleens after various treatments. (The label *** indicates p < 0.001).
Data Sharing Statement
Any display item and related data are available upon request.